


Join thousands of students achieving their dreams with expert-led courses.
Join free and unlock everything on EasyShiksha.
Takes less than 3 seconds — no password needed
Please enter a valid email address.
Checking your email…
Almost done — just verify your number so we can send course updates and certificates.
Used only for verification & updates
Incorrect OTP. Please try again.
Takes less than 10 seconds
Please select your country.
Please select your state.
D3.js, a powerful library that enables you to build customized visualisations for any kind of storytelling you could imagine for the web. Problem solving through data analysis and programming, on the other hand, is still very much rooted in the linear perspective, since they involve a step by step breakdown of data to understand and solve a problem. However, data analysis when done correctly allows a user to account for minute details and idiosyncrasies that are usually missed when looking at the whole picture. Combing a data driven approach along with a more visual oriented approach provides a holistic approach to problem solving and analysis that combines linear and non-linear perspectives.
What I will demonstrate is how a user can effectively create a data processing back end in python while maintaining a visual front end in d3.js to create an effective application. We will also add some controllable features so that the front end and the back end can communicate with each other effectively on the basis of inputs from the final user. The python module we will use is ‘Flask’ which will act as the intermediary between the back end and the front end. The d3 visualization I have chosen is the collapsible bar chart example created by Mike Bostock. Creation of the visualization structure will involve some use of html, js and some jinja code. Combining python and d3.js to create dynamic visualization applications.
Defining the structure of the application
What we will be doing, is create a front end on a html page which will host our visualization and d3.js scripts. We will send the data to this html page from python code contained in a file called ‘application.py’. The structure of the application on the computer will be as follows.
First, let’s design the front end which will be a basic html page (“index.html”) which will host our d3 visualization along with a form where a user can submit a
country and year selection. The final html is hosted here.
<input name=”Country_field” placeholder=”Enter country name” > <input type=”number” name=”Year_field” placeholder=”Enter Year” > <input type=”submit” value=”Submit Country and Year” > </form>
Now, we will create two divisions, one to host the production data graph on the left and one to host the loss data on the right. The divisions should also display the country and the year selected. We will have to specify ids for the graphs and will have to write out some code in jinja to get the country name and the year. Combining python and d3.js to create dynamic visualization applications
We will have to repeat the same code to create another division for the loss data.
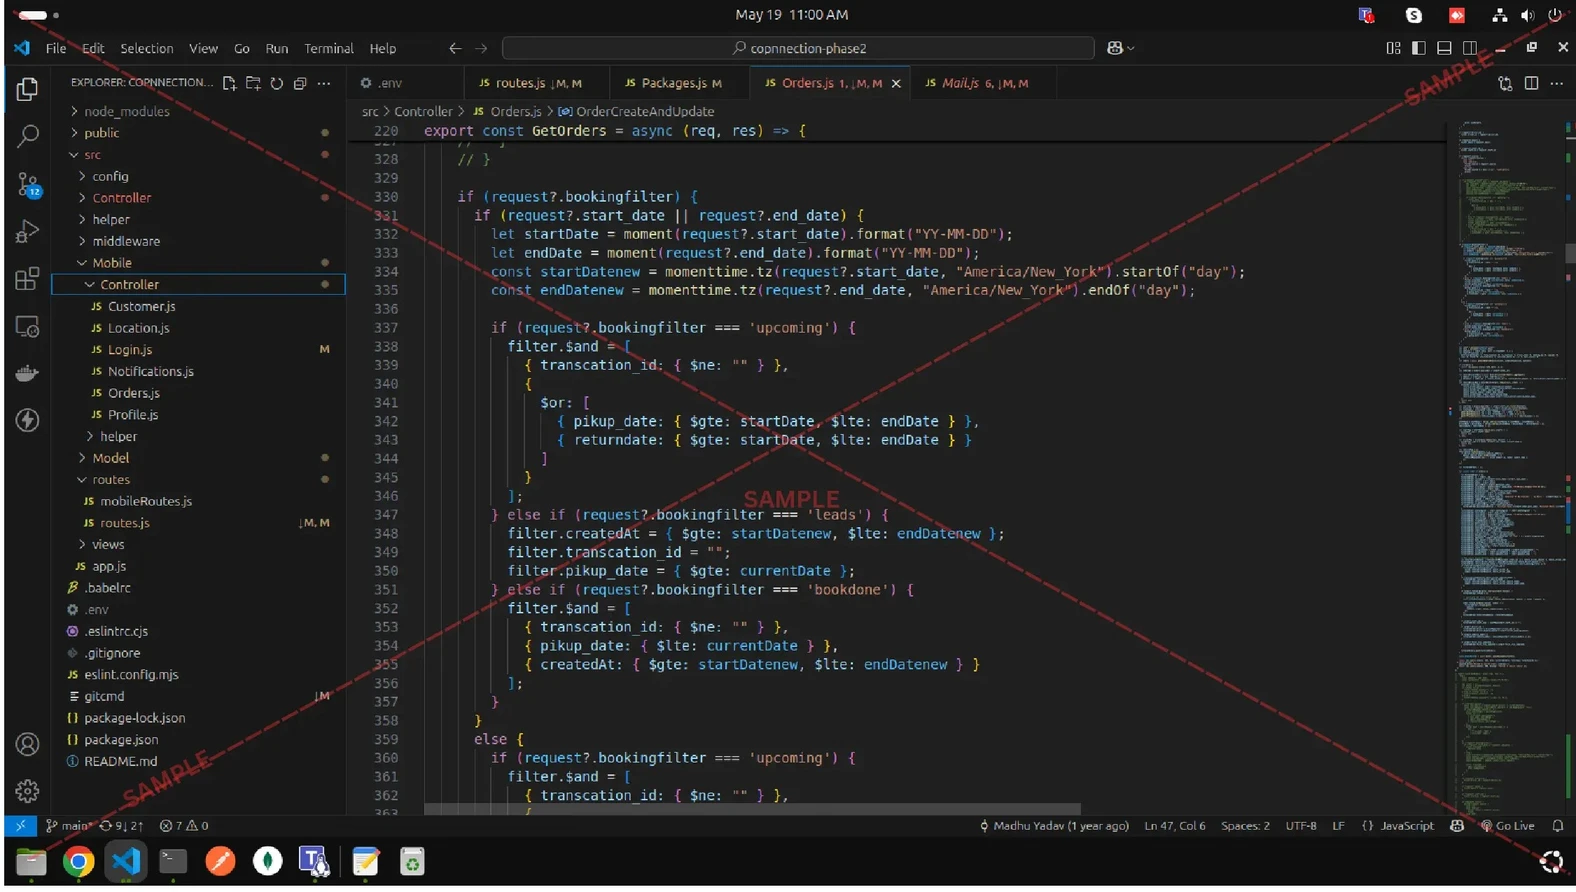
Third step is creating backend in Python
The steps in creating the python file are a bit more time consuming. The final application file is available here. We will need to perform the following steps,
1. Import neccessary packages, define the application in flask and create a datastore.
2. Create the code to generate data to send to the front end for the home page.
3. Convert data into json format for d3 and send the same to the front end
I hope you like this blog, to learn more visit HawksCode and Easyshiksha
More News Click Here

_(1).jpg)
.jpg)


Discover thousands of colleges and courses, enhance skills with online courses and internships, explore career alternatives, and stay updated with the latest educational news..
Gain high-quality, filtered student leads, prominent homepage ads, top search ranking, and a separate website. Let us actively enhance your brand awareness.
Download EasyShiksha Mobile Apps from Android Play Store, Apple App Store, Amazon App Store, and Jio STB.
1 million+ learned on the EasyShiksha App
Trusted by Standards & Global Compliance Frameworks


Built under internationally recognized standards for quality, information security, educational excellence and business continuity.
ISO 9001:2015 | ISO/IEC 27001:2022 | ISO 21001:2018 | ISO 22301:2019 | DPIIT Recognized Startup | MSME Registered


.jpg)