The growing use of data across industries is changing the skills students need to develop before entering professional environments. Businesses, healthcare organisations, financial institutions, technology companies, research laboratories, and manufacturing units generate enormous quantities of information every day. However, much of this information does not arrive in neatly organised tables or predefined spreadsheet columns. It may exist as customer reviews, emails, maintenance reports, scanned documents, product descriptions, interview transcripts, research notes, social media discussions, technical logs, images, and other forms of unstructured data. Professionals must often examine these sources, identify relevant information, organise it, interpret patterns, and use their findings to make decisions.
This creates an important challenge for conventional education. Students may learn statistical formulas, spreadsheet operations, data visualisation, and analytical concepts through structured exercises, but still struggle when they encounter information that has no predefined format. A classroom dataset containing clearly labelled columns and consistent numerical values is considerably easier to analyse than a collection of customer complaints, incomplete survey responses, technical incident reports, or unorganised business records. Real industry information requires students to determine what the data represents before deciding how it should be analysed.
Educational worksheets could help address this gap by introducing data interpretation challenges built around unstructured industry datasets. Instead of presenting students with perfectly organised information and asking them to calculate an answer, worksheets could provide realistic collections of raw information that require investigation, classification, cleaning, interpretation, and evidence-based conclusions. Students would learn to identify useful information, recognise missing context, distinguish facts from opinions, and understand the limitations of the data before making recommendations.
For EasyShiksha, this approach creates an opportunity to make worksheets more advanced, practical, and closely connected to industry expectations. Through online courses, quizzes, educational games, practical assignments, and internships, students could gradually develop the ability to work with information in its original form. The objective would not simply be to teach data analysis techniques but to prepare learners to investigate imperfect information and convert it into meaningful knowledge.
Understanding Unstructured Industry Datasets
Unstructured data refers to information that does not follow a consistent predefined tabular structure. Unlike a traditional spreadsheet containing clearly labelled fields such as date, customer ID, product name, and sales amount, unstructured information may contain paragraphs, conversations, images, audio recordings, documents, or technical descriptions. It often requires additional interpretation before it can be analysed effectively.
For example, an online retail company may collect thousands of customer reviews describing product quality, delivery delays, packaging problems, payment experiences, and customer support interactions. These reviews contain valuable information, but customers express their experiences in different languages, writing styles, sentence structures, and levels of detail. Some reviews may contain several complaints within one paragraph, while others may use informal language, abbreviations, or incomplete sentences. Students analysing this information must first understand what each review communicates before attempting to identify broader patterns.
A manufacturing organisation may generate maintenance reports describing equipment failures, unusual sounds, temperature changes, replacement activities, and inspection observations. These reports may be written by different technicians using inconsistent terminology. A healthcare research team may maintain clinical notes, patient feedback, and observational records that contain valuable qualitative information but cannot be analysed through simple numerical calculations alone.
Unstructured datasets are therefore not necessarily disorganised or useless. They contain information that has not yet been converted into a consistent analytical format. The challenge is to understand the context, identify relevant details, establish categories, and determine which analytical methods are appropriate.
Educational worksheets based on these datasets could introduce students to the type of information they may encounter in professional environments. Rather than assuming that all useful data is already organised, students would learn how to work with information before it becomes suitable for formal analysis.
Why Traditional Worksheets May Not Be Enough
Traditional educational worksheets generally provide questions followed by structured information. Students may receive a table of numerical values, a short case study, a diagram, or a predefined dataset and then complete calculations or answer interpretation questions. These exercises are useful for developing foundational knowledge, but they often remove the initial challenges involved in working with raw information.
In professional environments, analysts are not always given a clean dataset with clearly defined variables. They may need to search through documents, understand inconsistent descriptions, identify duplicate records, distinguish relevant information from unrelated details, and determine whether the available evidence is sufficient to answer a business question. These activities require a combination of analytical knowledge, interpretation, critical thinking, and technical skills.
A worksheet that asks students to calculate the average monthly sales from an organised spreadsheet evaluates their ability to perform a calculation. However, a worksheet that provides customer messages, invoices, product complaints, and sales notes requires students to determine which pieces of information are relevant before calculating anything. The second exercise introduces a more realistic analytical challenge because it tests the ability to construct a dataset from raw information.
Another limitation of conventional worksheets is that they sometimes provide questions that reveal the expected analytical direction. When a question explicitly asks students to calculate a percentage or identify the highest value, learners already know which operation to perform. In an industry-based challenge, students may first need to determine what the actual problem is and which information can help solve it.
By introducing unstructured industry datasets, EasyShiksha could extend the purpose of educational worksheets. They could become practical investigation environments in which students learn to define problems, organise evidence, select analytical methods, and communicate conclusions.

Designing Worksheets Around Real Industry Data
The first step in developing an industry-oriented worksheet is selecting a realistic business or professional situation. The dataset should represent a problem that an organisation might genuinely investigate, rather than an artificial collection of unrelated information. Students should understand the context in which the information was generated and the decision that the analysis is expected to support.
For example, a retail analytics worksheet could investigate why customer satisfaction has declined over a particular period. Instead of supplying a structured satisfaction table, the worksheet could provide sample customer reviews, delivery complaints, return requests, support conversations, and product feedback. Students would need to identify the recurring concerns, classify the comments, and determine whether the available information suggests a particular operational problem.
A cybersecurity worksheet could introduce students to a collection of simulated security incident descriptions, system alerts, employee reports, and suspicious activity records. Students would need to identify relevant events, recognise repeated patterns, separate routine activity from potentially suspicious behaviour, and prepare an initial incident summary. The activity would introduce the importance of context and evidence without exposing students to real confidential systems.
A healthcare data worksheet could use fictional, anonymised patient feedback and research observations to examine service quality or appointment delays. Students could classify comments, identify recurring operational issues, and recognise the difference between a patient's reported experience and a clinically verified finding.
The important design principle is that the raw information should be connected to a clear analytical objective. Students should know what question they are investigating, but they should not be given every analytical step in advance. This allows them to develop the ability to decide how information should be processed and interpreted.
Introducing Data Classification and Information Extraction
One of the first challenges students encounter when working with unstructured information is identifying the important details within a large collection of content. A customer review may contain several observations, but only some may relate directly to the business problem being investigated. A technical report may include equipment identification, inspection details, operational conditions, and maintenance recommendations within the same paragraph.
An effective worksheet could require students to extract relevant information and convert it into identifiable categories. In a customer feedback exercise, learners might examine a collection of reviews and identify references to product quality, delivery time, packaging, payment problems, and customer support. They would then organise the extracted information into a consistent classification structure.
This process introduces the difference between raw information and structured data. Students learn that classification decisions influence the quality of later analysis. If two similar complaints are placed into unrelated categories, the final findings may incorrectly suggest that the organisation has several different problems rather than one recurring issue.
The worksheet could also introduce ambiguous information. A customer writing that an order arrived much later than expected may be reporting a delivery issue, but the reason for the delay may not be available. Another customer may complain that an item was difficult to use without identifying whether the problem involved product design, instructions, or personal preference. Students must avoid assigning a definite cause when the available information does not support one.
For EasyShiksha, this activity could connect directly with courses in data analytics, business intelligence, artificial intelligence, and research methods. Students would practise identifying information, designing categories, and documenting classification decisions before moving towards more advanced analytical techniques.
Data Cleaning Challenges: Working With Incomplete and Inconsistent Information
Raw industry information often contains inconsistencies that make analysis difficult. Different employees may use different terms for the same event, customer records may contain spelling variations, and reports may omit important details. Some information may be duplicated, outdated, incomplete, or recorded in incompatible formats.
A worksheet based on these conditions could teach students why data cleaning is an essential part of analytical work. Instead of providing a perfectly prepared dataset, the activity could include several versions of the same company name, inconsistent date formats, incomplete product descriptions, repeated complaints, and records containing missing values.
Students could be asked to identify the inconsistencies and decide how each should be handled. They might standardise terminology, identify duplicate entries, separate incomplete records, and document information that cannot be confidently corrected. The exercise would demonstrate that cleaning data is not simply a technical activity. It also involves judgement, transparency, and an understanding of the information's original context.
An important part of the challenge is distinguishing between information that can be corrected and information that should remain incomplete. If a date is recorded using a different format, it may be possible to standardise it without changing its meaning. However, if a customer report does not specify the product model, students should not invent the missing information.
This distinction is essential because inaccurate cleaning can create misleading datasets. Students should understand that removing incomplete records or filling missing values without justification may influence the final results. A professional analyst must explain important data-cleaning decisions and recognise how those decisions affect the reliability of conclusions.
EasyShiksha worksheets could introduce these situations through progressively complex exercises. Beginners could work with simple spelling variations and duplicate records, while advanced learners could investigate conflicting reports, incomplete descriptions, and ambiguous observations.
Teaching Students to Identify Patterns in Qualitative Information
Unstructured industry datasets frequently contain qualitative information rather than direct numerical measurements. Qualitative data describes experiences, opinions, observations, explanations, and behaviours. It is common in customer research, employee feedback, healthcare studies, product testing, and social science investigations.
Students often associate data analysis with numbers, formulas, and graphs. However, qualitative information can also reveal important patterns when it is examined systematically. For example, a collection of employee feedback messages may indicate recurring concerns about workload, communication, training, or management support. A set of customer reviews may reveal that complaints about product quality are concentrated around a particular product category.
An educational worksheet could provide a collection of short fictional interviews or feedback responses and ask students to identify recurring themes. Learners would need to examine the language, compare similar statements, create meaningful categories, and explain why certain observations belong together.
The activity could become more challenging by including contradictory opinions. Some customers may report that a service is fast, while others may describe long waiting periods. Students should investigate whether the difference relates to location, time, service type, or individual experience. They should not assume that one group is necessarily incorrect.
This type of worksheet can develop skills in qualitative research, thematic analysis, evidence interpretation, and critical thinking. It can also introduce students to the limitations of small samples. A recurring theme in a limited collection of comments does not automatically represent the opinion of an entire customer population.
For EasyShiksha, qualitative data interpretation could become a valuable component of courses related to marketing, psychology, business research, human resources, healthcare administration, and communication. It would help learners understand that useful analytical insights can emerge from both numerical measurements and written observations.
Industry-Specific Worksheet Challenges
The value of unstructured data worksheets increases when the challenges reflect different professional environments. Each industry produces information in its own formats, uses specialised terminology, and faces different analytical problems. Introducing these differences can help students understand how general data interpretation skills apply across professional fields.
Retail and E-Commerce Data Investigation
Retail businesses generate information through customer reviews, product descriptions, return requests, delivery complaints, support conversations, and promotional feedback. A worksheet could present students with a fictional collection of these records and ask them to investigate why a particular product category is experiencing an increase in returns.
Students would need to identify complaints related to product quality, incorrect descriptions, sizing problems, packaging, and delivery damage. They could compare customer statements, classify recurring concerns, and develop a preliminary explanation for the increase in returns. If the dataset also contains product and date information, learners could examine whether particular issues appear more frequently within certain categories or periods.
The activity would demonstrate that business analysis involves more than calculating return percentages. Students must first understand what customers are reporting and determine whether the available evidence supports a particular explanation.
Healthcare and Patient Experience Analysis
Healthcare organisations may generate unstructured information through patient feedback, appointment observations, service complaints, research notes, and administrative reports. A worksheet could introduce fictional patient experience records to investigate the factors associated with long waiting times.
Students could identify comments referring to registration delays, appointment scheduling, communication difficulties, and service availability. They would then organise the information into themes and explain which operational issues appear repeatedly.
The activity should make a clear distinction between administrative information and medical conclusions. Students must not interpret general patient comments as clinical evidence or attempt to diagnose medical conditions from incomplete records. The purpose would be to develop data interpretation and service analysis skills within an appropriately controlled educational context.
Manufacturing and Equipment Maintenance Analysis
Manufacturing environments produce maintenance logs, inspection reports, equipment observations, quality-control notes, and production incident descriptions. These records may contain inconsistent terminology because different technicians describe similar problems in different ways.
A worksheet could provide simulated maintenance reports from a fictional manufacturing facility. Students would investigate repeated equipment stoppages and identify possible patterns involving machine types, operating conditions, maintenance activities, and reported symptoms.
The challenge could require learners to distinguish observed symptoms from confirmed causes. If a technician reports unusual vibration before a machine stops, students should not automatically conclude that vibration caused the failure. They would need to identify what additional evidence is required before making that conclusion.
This exercise could introduce engineering students to maintenance analytics, technical documentation, operational reliability, and evidence-based investigation.
Cybersecurity and Technical Incident Analysis
Cybersecurity teams frequently investigate information from security alerts, incident reports, system logs, user complaints, and technical documentation. A worksheet could present a simulated collection of security incidents involving unusual login attempts, suspicious emails, access requests, and employee reports.
Students would classify the records, identify repeated patterns, and determine which incidents require further investigation. They could examine whether multiple alerts involve the same account, time period, or type of activity. They would also learn that an unusual event is not automatically proof of a cyberattack.
The worksheet could introduce basic incident classification and evidence evaluation without requiring access to real networks or confidential security information. It would help connect cybersecurity theory with the analytical tasks involved in investigating suspicious activity.
Marketing and Customer Behaviour Analysis
Marketing teams collect information from survey responses, campaign feedback, social media comments, customer interviews, and product discussions. These sources can help organisations understand audience preferences, but the information may contain informal language, repeated opinions, and contradictory responses.
A worksheet could ask students to investigate why a fictional marketing campaign received mixed feedback. Students would classify comments according to brand awareness, message clarity, pricing concerns, product interest, and audience expectations. They could then compare themes and prepare a recommendation supported by the available evidence.
The exercise would help learners understand that marketing decisions should not be based on isolated comments or assumptions about customer behaviour. They must identify patterns, examine the limitations of the dataset, and distinguish evidence from personal interpretation.
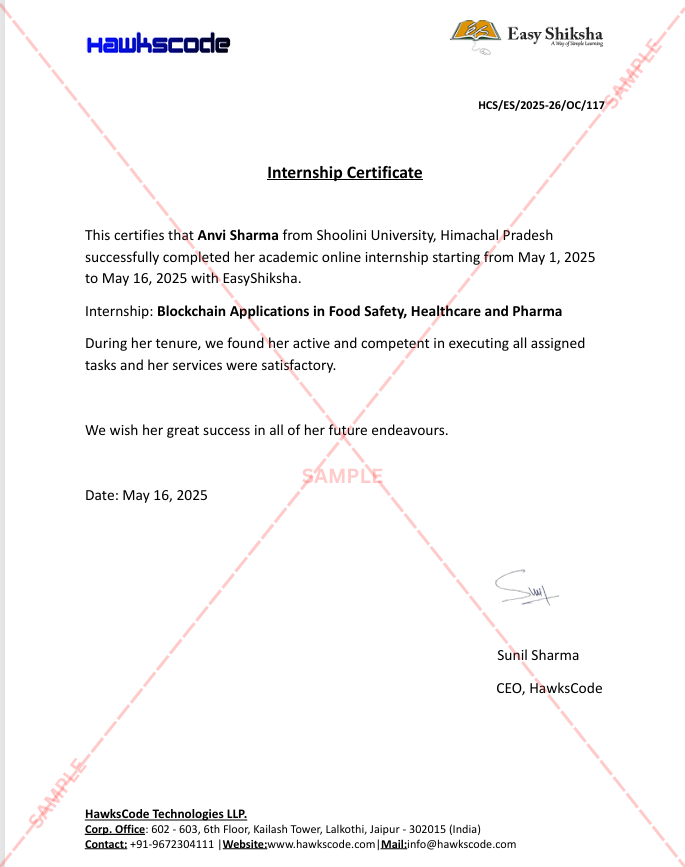
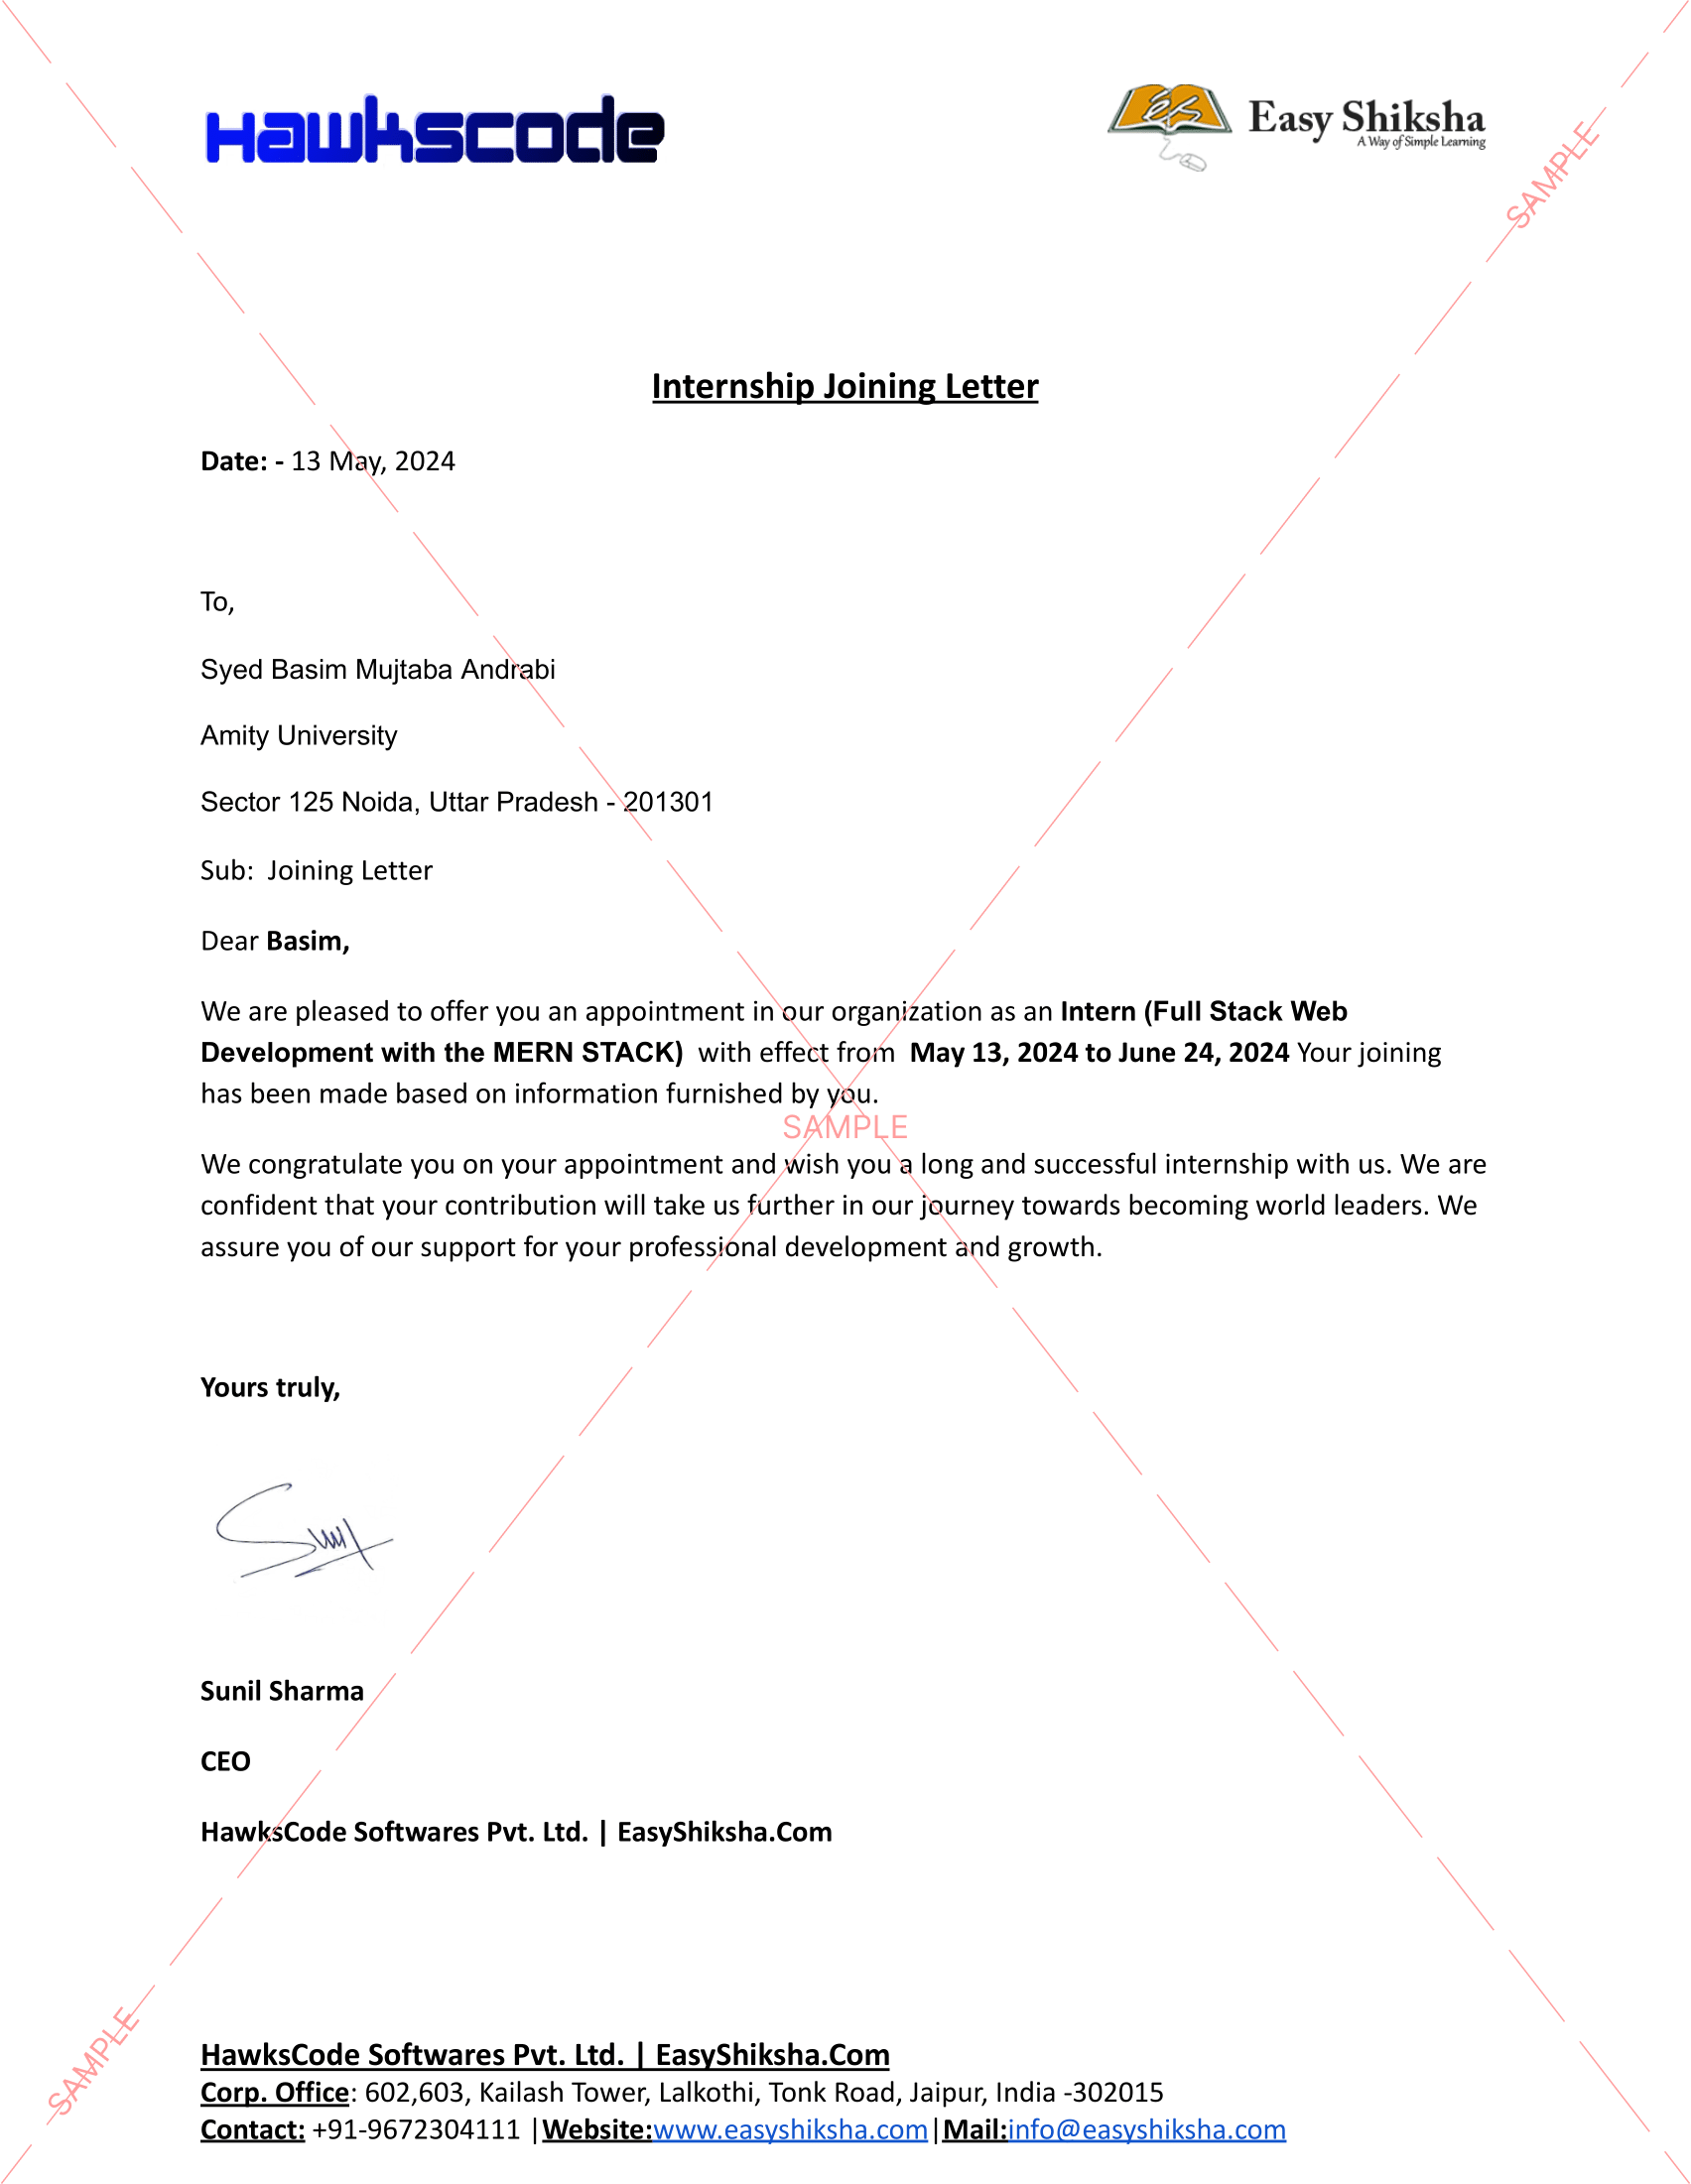
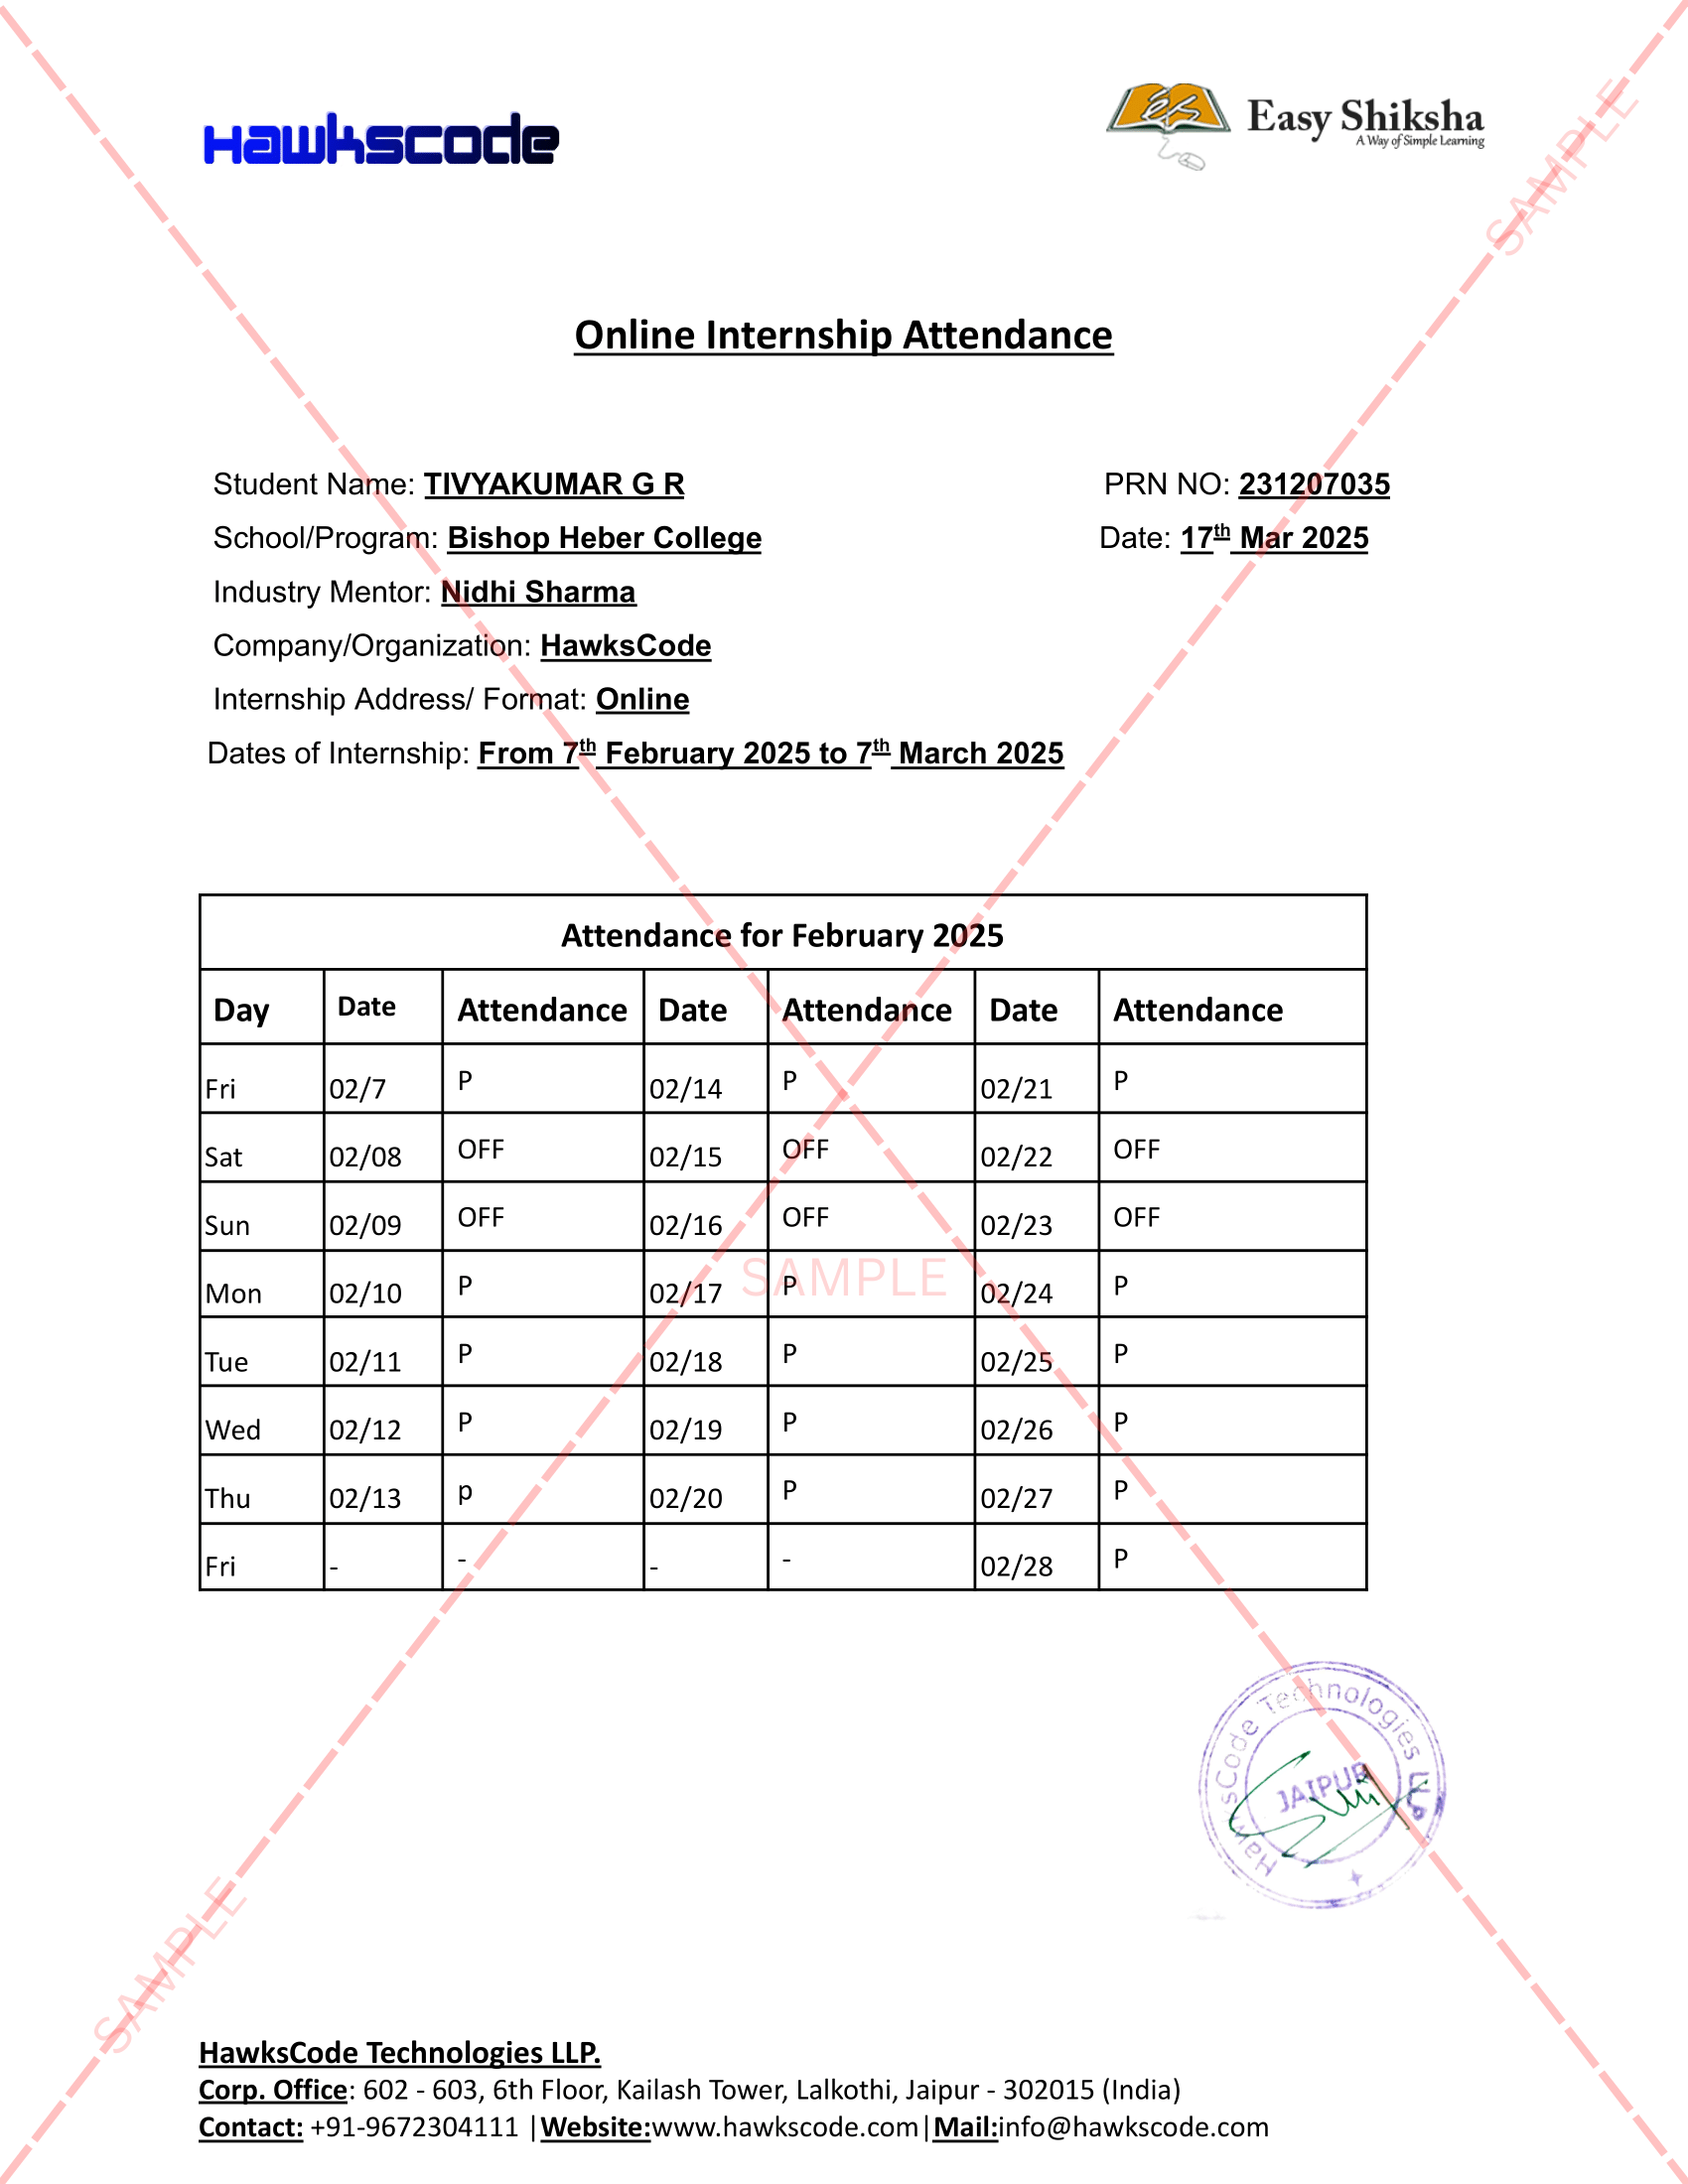
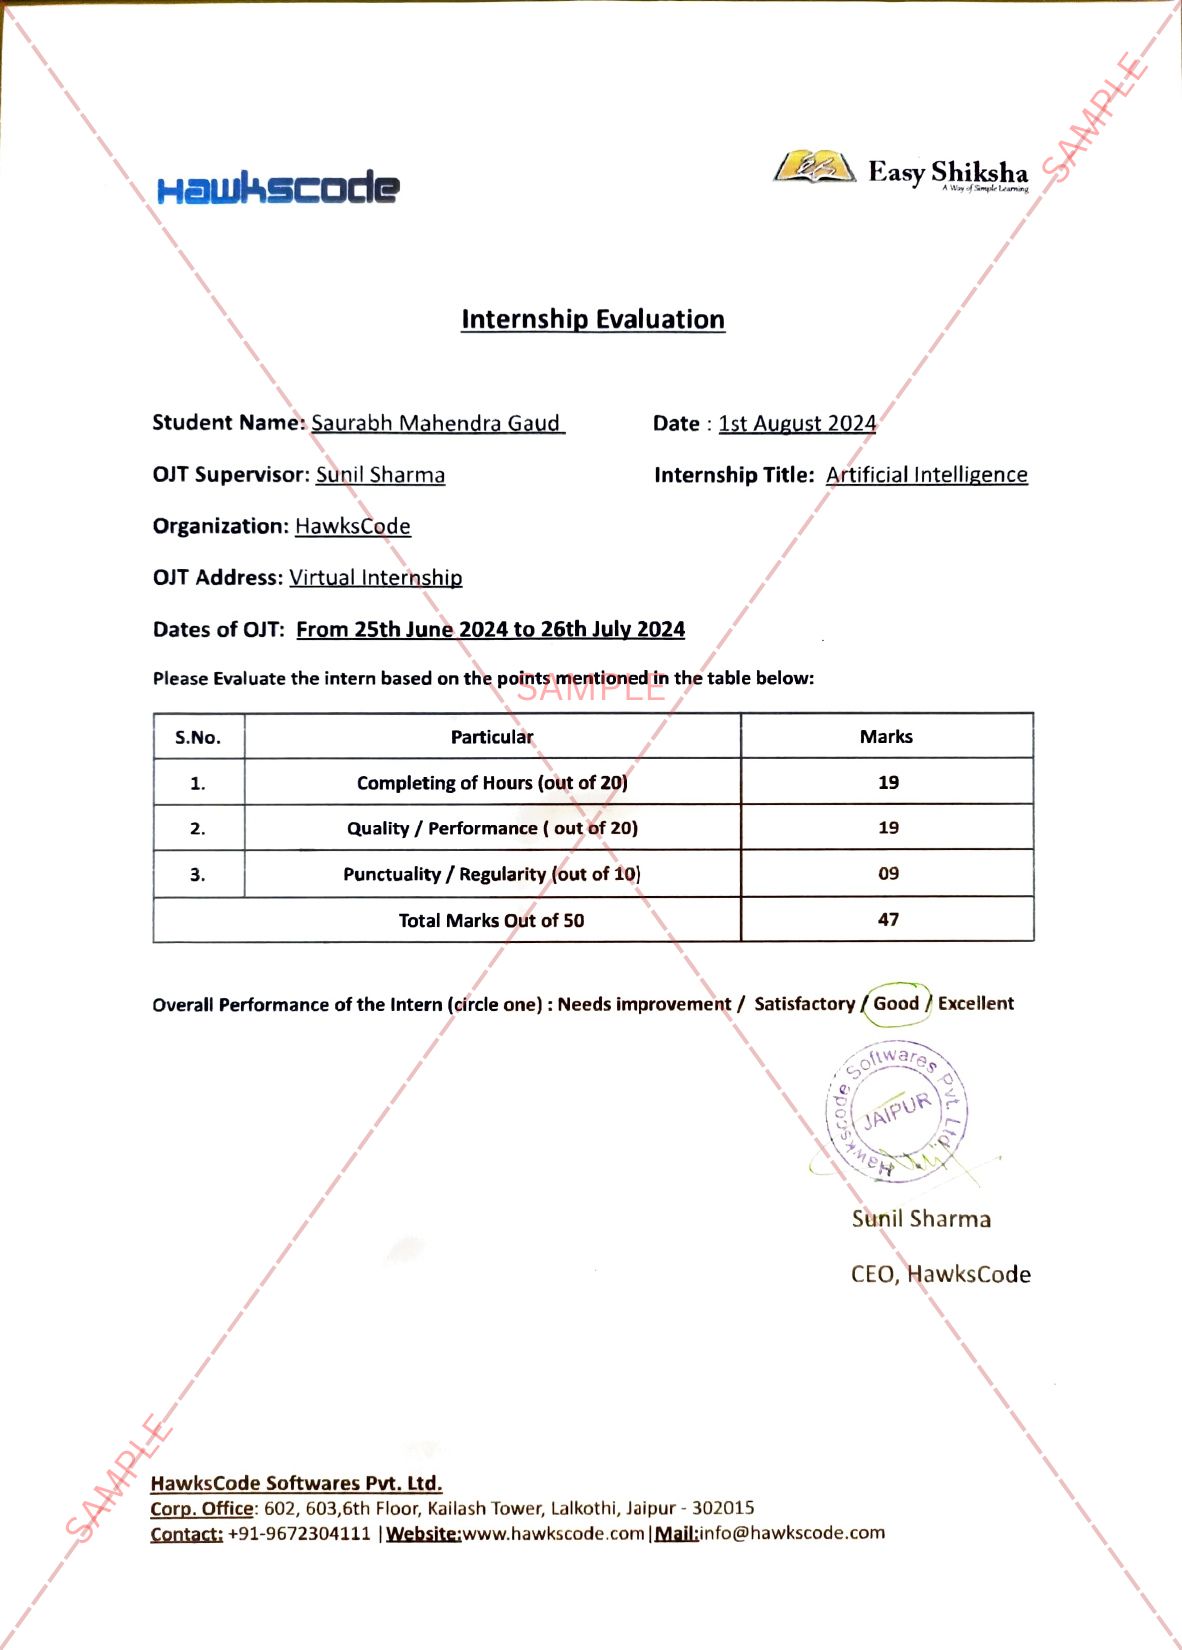
Insights from Internship Students: Testimonials
Connecting Unstructured Data Worksheets With AI and Machine Learning
Artificial intelligence and machine learning are increasingly used to process large collections of unstructured information. Natural language processing can help identify topics in written content, sentiment analysis can estimate the emotional tone of customer feedback, and document-processing systems can extract information from reports and scanned files. Image recognition can identify visual patterns, while machine learning models can classify information based on previously identified examples.
Educational worksheets could introduce these technologies without requiring every student to build a complex AI model. A beginner activity might ask students to manually classify customer comments and compare their categories with the output of a basic automated classification tool. They could then investigate where the tool produces inaccurate or incomplete results.
An advanced worksheet could provide a simulated dataset of customer reviews and ask students to evaluate how an AI system classifies positive, negative, and neutral feedback. Students might discover that a sentence containing criticism and praise can be difficult to classify accurately. They could also examine how sarcasm, regional language, spelling mistakes, and cultural context affect automated interpretation.
This creates an important learning opportunity because students understand that AI-generated results are not automatically correct. The quality of automated analysis depends on the data, the classification rules, the model's limitations, and the context in which the results are used.
EasyShiksha could connect such worksheets with AI, machine learning, Python, and data science courses. Students could first learn the concepts through online lessons, practise manual interpretation through worksheets, and then explore automated methods through programming exercises or practical projects. This progression would help learners understand both the capabilities and limitations of AI-based data analysis.
Introducing Multi-Stage Data Interpretation Challenges
A particularly useful development would be to organise worksheets into multi-stage investigations. Instead of asking students to complete a single isolated task, the worksheet could guide them through a sequence in which each stage depends on the quality of the previous one.
For example, a business intelligence worksheet might begin with a collection of unstructured customer feedback records. Students would first identify the business problem, extract relevant information, classify customer comments, and clean inconsistent records. They would then convert the information into a structured format and identify recurring patterns.
The next stage could introduce numerical data, such as monthly sales, return rates, or delivery times. Students would combine the qualitative findings with numerical measurements to investigate whether customer complaints correspond with changes in business performance. Finally, they would prepare a written report explaining their findings and recommending an appropriate action.
This approach introduces the idea that industry analysis is a connected process rather than a collection of unrelated technical operations. A mistake made during classification can influence later calculations, while an unsupported assumption can affect the final recommendation. Students learn to recognise these dependencies and understand why analytical quality must be maintained throughout the investigation.
For EasyShiksha, multi-stage worksheets could support advanced learning pathways in business analytics, finance, marketing, computer science, engineering, and research. They could also provide a foundation for practical projects and internship assignments in which students work with increasingly realistic datasets.
Assessing More Than the Final Answer
When students work with unstructured datasets, the final conclusion is only one part of their performance. Two students may reach similar conclusions but use very different approaches. One may have carefully classified the information, documented limitations, and compared multiple sources. Another may have selected a conclusion based on a small number of comments without examining the full dataset.
An effective assessment framework should therefore examine the process as well as the outcome. It should consider whether students identified relevant information, organised it consistently, explained their classification decisions, recognised missing information, and supported conclusions with evidence.
For example, a student who identifies that delivery complaints appear frequently in a retail dataset should explain how the complaints were classified and whether duplicate messages were removed. If the dataset does not include delivery dates or order locations, the student should acknowledge that these missing details limit the investigation.
This type of evaluation can also reveal different learning difficulties. A student may be skilled at organising information but struggle to interpret patterns. Another may identify relevant themes but make unsupported conclusions. A third may produce a reasonable report but fail to explain how the raw information was processed.
EasyShiksha could use such assessment criteria to provide more meaningful feedback. Instead of evaluating only whether the final answer matches a predefined solution, the platform could recognise the quality of the student's analytical process and identify areas for improvement.
Using Educational Games to Reinforce Data Interpretation Skills
Educational games can complement worksheets by transforming data interpretation into interactive decision-making experiences. A student might enter a simulated business environment where the organisation is experiencing a problem and must investigate different collections of information before choosing an action.
In a retail simulation, learners could examine customer complaints, inventory reports, product descriptions, and delivery observations. They would need to identify the most relevant information before deciding whether the problem relates to stock availability, product quality, or delivery operations. Each decision could reveal additional information about the consequences of an incomplete investigation.
In a cybersecurity game, students could investigate simulated alerts and incident descriptions. They might need to distinguish harmless technical events from suspicious activity, identify relationships between reports, and decide which evidence should be examined next.
The educational value of these games comes from the opportunity to test decisions and receive feedback. Students can see how incomplete classification, incorrect assumptions, or overlooked information affect their conclusions. They can then revisit the investigation and try a different approach.
EasyShiksha could connect game-based challenges with worksheets and online courses so that students practise the same analytical concepts through different formats. A course could introduce the theory, a worksheet could develop structured investigation skills, and a game could test whether students can apply those skills in a changing environment.
Building a Practical Learning Pathway Through EasyShiksha
The introduction of unstructured industry datasets could become part of a broader learning pathway within EasyShiksha. Students could begin with foundational courses that explain data types, basic statistics, spreadsheets, and information classification. Once they understand these concepts, they could complete worksheets that introduce incomplete records, inconsistent descriptions, and qualitative information.
The next stage could introduce more advanced activities involving data cleaning, thematic analysis, pattern identification, and evidence-based reporting. Students could then explore programming tools such as Python and spreadsheet functions to organise and process information more efficiently. AI-related courses could introduce natural language processing, automated classification, and the evaluation of machine-generated results.
Quizzes could assess conceptual understanding, while educational games could introduce interactive investigations. Practical projects could require students to analyse a simulated industry dataset and submit a structured report. Internship activities could provide further opportunities to apply these skills to realistic tasks under appropriate supervision.
This learning pathway would help connect different parts of the EasyShiksha ecosystem. Instead of treating courses, quizzes, worksheets, games, and internships as separate learning products, they could function as connected stages of practical skill development.
Students would gradually move from understanding what data is to investigating how information is generated, organising it, analysing it, and using it to support decisions. This progression could make online learning more relevant to the analytical requirements of modern workplaces.
Creating Industry-Ready Student Portfolios From Worksheet Projects
A well-designed worksheet challenge can produce evidence of practical ability when students complete it as a structured investigation. Instead of submitting only answers, learners could prepare a short analytical report explaining the original problem, the dataset used, the processing decisions made, the patterns identified, and the limitations of the findings.
For example, a student completing a retail feedback worksheet could present a categorised customer feedback dataset, explain how repeated complaints were identified, and describe the possible relationship between customer concerns and product returns. A data science student could document how text information was cleaned and prepared for analysis. A cybersecurity learner could explain how simulated incident reports were classified and prioritised.
These projects could become part of a student's academic or professional portfolio. They would demonstrate the ability to work with imperfect information rather than simply reproduce calculations from a textbook.
EasyShiksha could connect worksheet-based projects with its online courses and internship opportunities. Students could use completed assignments as evidence of learning and demonstrate how their analytical skills have developed over time. However, a worksheet project should be presented honestly as an educational exercise, not as professional industry experience unless it was actually completed within a supervised workplace engagement.
This distinction is important for maintaining the credibility of certificates, project records, and internship-related achievements.
- Career Helper suggests occupations that correspond to your interests, values, aspirations, and personality.
-
Career Helper consists of:
- IQ Test
- Basic Test
- Advance Test
- Psychometric Test
- Know your talents, skills, strengths, and weaknesses.
- Choose the profession that suits you best.
- Get best career guidance by Experts.
- Explore various career options in India with EasyShiksha.
Challenges in Introducing Unstructured Datasets Into Education
Although industry-based worksheets can improve practical learning, their development requires careful planning. One major challenge is dataset quality. Real-world information may contain confidential details, personal information, commercially sensitive material, or inaccurate records. Educational platforms should therefore use appropriately licensed public datasets, carefully anonymised material, or fictional datasets designed to reproduce realistic industry conditions.
Another challenge is complexity. Unstructured information can overwhelm beginners if worksheets introduce too many documents, unfamiliar terms, or ambiguous records at the same time. Learning activities should gradually increase in difficulty. Early worksheets can use short customer comments or simple maintenance notes, while advanced exercises can involve larger collections of documents, conflicting reports, and multiple information sources.
Assessment is another concern because unstructured datasets may support more than one reasonable interpretation. Students should not be penalised simply because their conclusions differ from a predefined answer when their reasoning is supported by the evidence. Evaluation should focus on the quality of the method, the consistency of classification, the appropriate use of information, and the justification provided for conclusions.
There is also a risk that students may rely too heavily on AI tools to classify or summarise information without understanding how the results were produced. Worksheets should therefore encourage learners to inspect original records, verify automated outputs, and explain important analytical decisions. AI should support investigation rather than replace critical thinking.
Finally, industry relevance must be maintained. Datasets and examples should reflect realistic professional problems, but they must also remain appropriate for the student's educational level. The objective is to introduce authentic analytical challenges without making learning unnecessarily complicated.
The Future of Practical Data Interpretation in Online Education
As organisations increasingly depend on data-driven decisions, the ability to interpret imperfect information is becoming an important part of professional competence. Future educational platforms may move beyond traditional worksheets containing predefined questions and structured tables. They could introduce interactive investigation environments in which students receive raw documents, incomplete records, customer feedback, technical observations, and other forms of information.
Students could be asked to identify the problem independently, decide which information is relevant, construct a usable dataset, and explain their conclusions. AI-supported systems could provide feedback on classification decisions, while teachers could review complex interpretations and evaluate the quality of the student's reasoning.
The same dataset could also support multiple learning activities. A beginner might classify customer feedback manually, while an advanced learner could use Python to process the information and compare the results with an AI-generated analysis. Another student might examine the business implications of the findings and prepare an operational recommendation.
For EasyShiksha, this model could create opportunities to develop advanced worksheets that connect academic concepts with practical industry challenges. It could strengthen the relationship between online courses, data analytics projects, educational games, quizzes, and internships. Students would learn not only how to use analytical tools but also how to decide which information matters, recognise uncertainty, and communicate evidence-based conclusions.
The larger opportunity is to make educational worksheets a starting point for professional investigation. Instead of presenting information that has already been organised for students, they could introduce the challenges of turning raw information into useful knowledge.
Conclusion
Could educational worksheets introduce data interpretation challenges using unstructured industry datasets? They certainly offer a promising way to make digital education more practical, analytical, and connected to workplace expectations. By working with customer reviews, technical reports, maintenance records, research observations, incident descriptions, and other forms of raw information, students can develop skills that conventional structured exercises may not fully assess.
The approach would help learners understand that data analysis begins before calculations and visualisations. They must first identify relevant information, understand its context, organise inconsistent records, recognise missing details, and determine whether the available evidence supports a conclusion. These abilities are important across business, finance, healthcare, manufacturing, cybersecurity, marketing, engineering, and technology.
For EasyShiksha, unstructured dataset worksheets could become a valuable part of an integrated learning ecosystem. Online courses could establish foundational knowledge, worksheets could develop investigation skills, quizzes could evaluate understanding, games could simulate industry decisions, and practical projects or internships could provide opportunities to apply those abilities.
Ultimately, the purpose of such worksheets would be to prepare students for the reality of professional data analysis, where information is rarely perfect and meaningful conclusions require careful investigation. By teaching students how to transform unstructured information into reliable insights, EasyShiksha could support a more practical and industry-oriented approach to digital learning.