A student's journey through education is often described as a sequence of major milestones: choosing a course, enrolling in a university, attending classes, completing examinations, earning a degree, finding an internship, and eventually getting a job. However, the real student experience is much more complex than this linear description suggests. Between these major milestones are hundreds of smaller interactions that influence what students learn, what they choose, where they struggle, what opportunities they discover, and how confidently they move toward their careers.
A student may first discover a course through a search engine, social media post, recommendation, advertisement, friend, teacher, or educational platform. The next interaction could involve reading the course description, comparing alternatives, watching an introductory lesson, taking a quiz, checking the certificate, exploring internship opportunities, or searching for career outcomes. After enrolment, the student may interact with lessons, assessments, projects, mentors, games, career tools, internship programs, university information, and job-preparation resources. Each interaction creates another piece of information about the student's journey.
The concept of a Student Experience Graph attempts to connect these interactions into a meaningful digital map. Instead of viewing a student as someone who simply completes courses, the graph represents the relationships between the student's interests, decisions, learning activities, skills, achievements, practical experiences, and career outcomes.
For an education ecosystem such as EasyShiksha, this concept opens the possibility of understanding learning as a connected journey rather than a collection of isolated transactions. Online courses, quizzes, internships, certificates, games, university programs, career guidance, and job-readiness experiences can become interconnected points within one continuously evolving student journey.
What Is a Student Experience Graph?
A Student Experience Graph can be understood as a digital representation of the interactions and relationships that shape a student's educational and career journey. The word "graph" refers to a network of connected points rather than a simple chart. Each point can represent an interaction, while the connections between points reveal how one activity influences another.
A student's first interaction with a learning platform might be discovering an article about a career. That interaction could lead to a course search. The course search could lead to comparing programs. A course enrolment could lead to lessons and quizzes. Quiz performance could reveal areas requiring additional practice. A practical project could demonstrate a developing skill. That project could lead to an internship recommendation. Internship experience could strengthen a career profile, which could eventually influence job recommendations.
The graph therefore captures relationships that traditional educational records often miss. A transcript may show that a student completed a course, but it may not explain what motivated the student to choose it, which topics interested them most, what challenges they encountered, or how the learning eventually influenced their career decisions.
The Student Experience Graph provides a conceptual framework for understanding these connections.
Why the Traditional Student Record Is Incomplete
Traditional education systems are generally designed around formal milestones. Students receive admission records, attendance information, examination results, transcripts, degrees, and certificates. These records are important, but they represent only a portion of the student experience.
Consider two students who both complete the same digital marketing course and receive identical certificates. On paper, their educational records may look almost identical. However, one student may have entered the course after discovering an interest in entrepreneurship, completed additional SEO projects, participated in an internship, and eventually pursued content strategy. The other may have taken the course simply to fulfil an academic requirement and later moved into finance.
The certificate cannot capture this difference.
A Student Experience Graph could represent these different journeys by connecting the student's interactions and decisions over time. It would show that education is not merely about completion but about the relationships between discovery, motivation, learning, practice, experience, and career development.
This perspective is increasingly relevant as students build education portfolios across universities, online platforms, internships, certifications, projects, and professional networks.
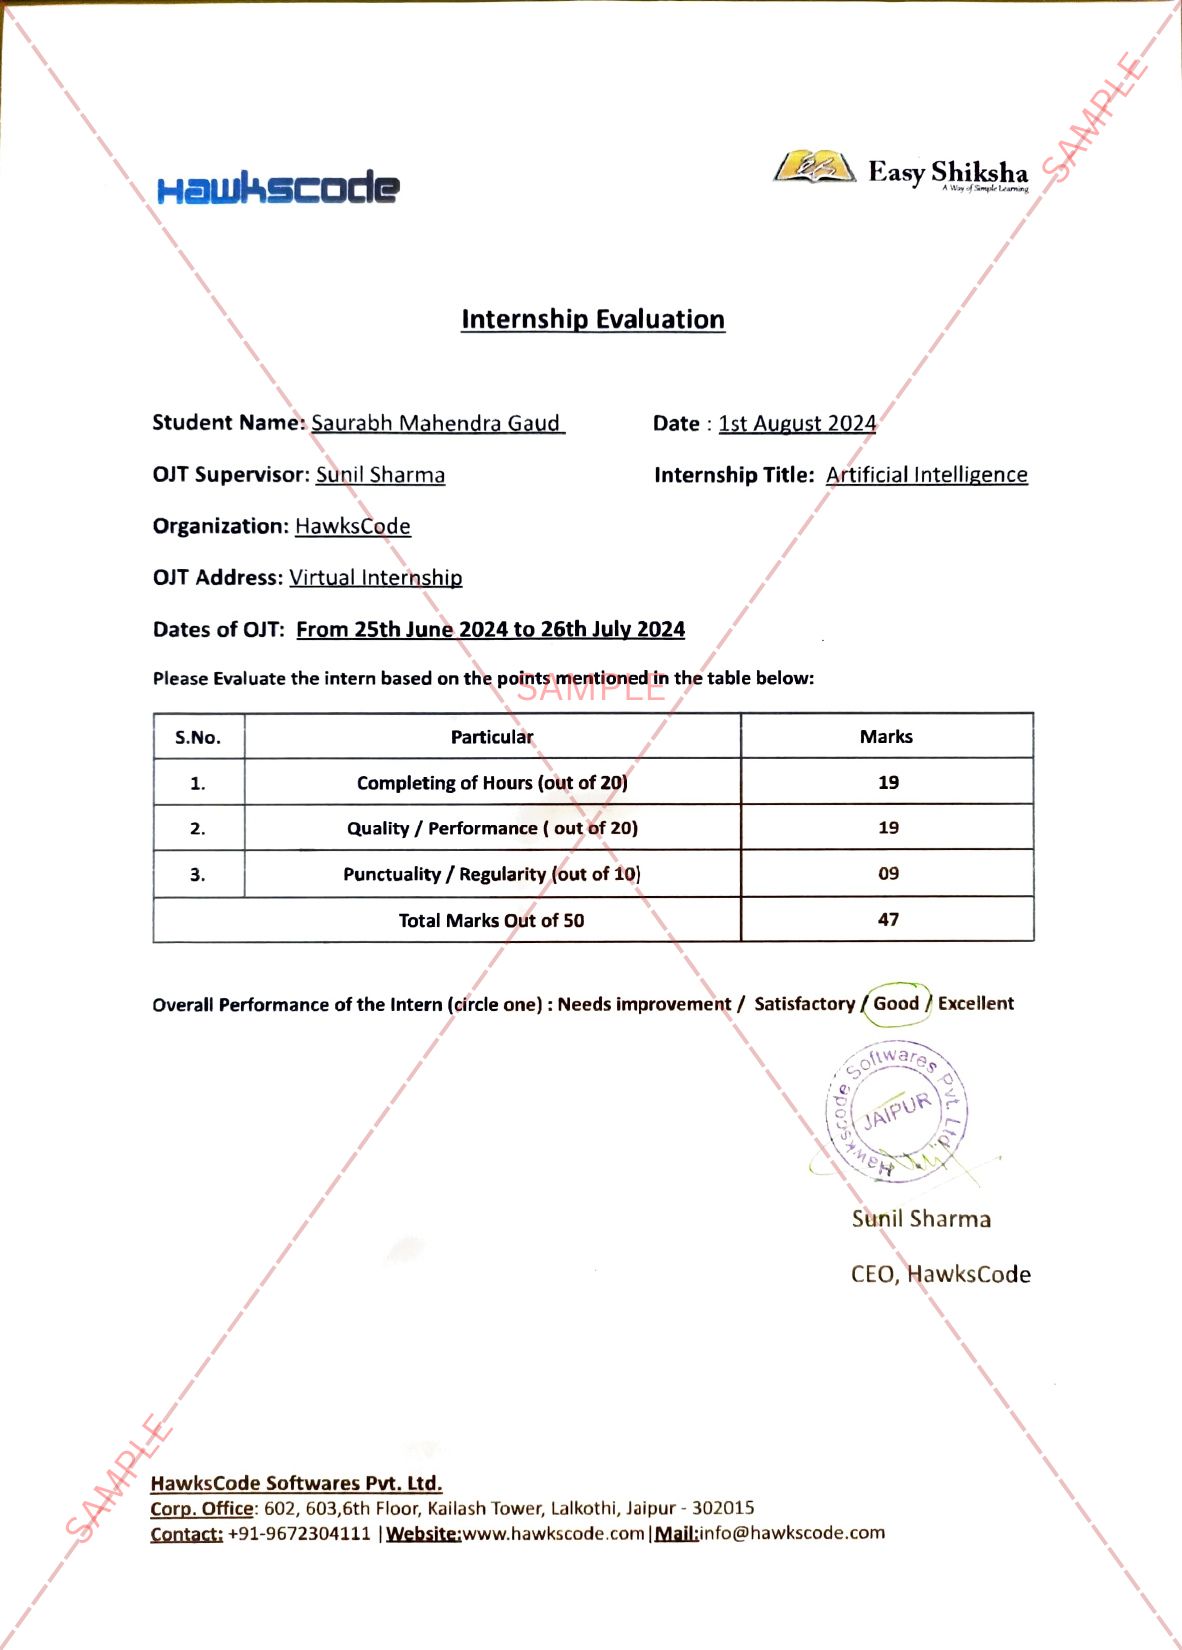
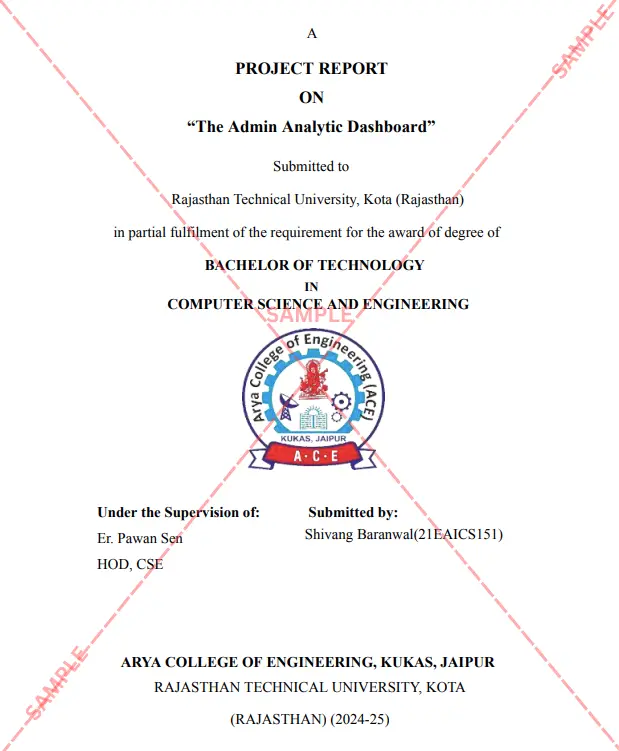
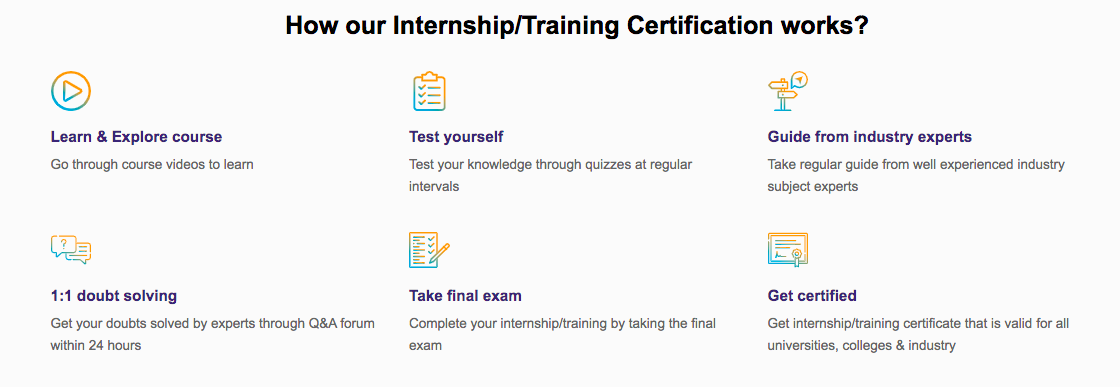
How EasyShiksha Internship/Training Program Works
The First Node: Course Discovery
The student journey often begins before enrolment. Course discovery is an important interaction because it reveals what attracts the learner's attention.
A student may search for "data science courses," explore artificial intelligence careers, read an article about cybersecurity, watch a video explaining digital marketing, or discover a university program through an online platform. These early interactions can provide insight into the student's emerging interests.
In a Student Experience Graph, discovery becomes an important starting point rather than an invisible pre-enrolment activity. The system can conceptually connect the student's initial interest with the eventual learning pathway.
For EasyShiksha, this creates an opportunity to connect educational content, career guidance, course discovery, quizzes, and learning pathways. A student interested in artificial intelligence, for example, could discover introductory material before being guided toward suitable courses and practical learning experiences.
The goal is not to manipulate students into enrolling. It is to make discovery more informative and help learners understand why a particular educational pathway may be relevant to their goals.
From Interest to Intent
Discovering a course does not necessarily mean that a student intends to enrol. There is an important decision-making stage between interest and commitment.
Students compare course duration, learning outcomes, certificates, fees, practical opportunities, difficulty level, career relevance, and available support. They may leave a page and return later. They may explore several subjects before choosing one. They may take a quiz to understand their interests or speak with someone before making a decision.
These interactions are valuable because they reveal how students make educational choices.
A Student Experience Graph can represent this transition from curiosity to intent. Instead of recording only the final enrolment, the system can understand the broader journey that led to the decision.
This can also help students themselves. When educational platforms make the pathway visible, learners can better understand why they chose a particular direction and whether their current learning remains aligned with their original goals.
The Learning Experience as a Network
Once a student begins a course, the experience becomes more detailed. A traditional learning management system may track lesson completion, assessment scores, and course completion. A Student Experience Graph can conceptualise these activities as interconnected experiences.
A student may watch a lesson, attempt a quiz, revisit a difficult concept, complete a practical exercise, search for additional information, and then attempt another assessment. These interactions reveal more than simple completion.
The system can potentially identify patterns in how students learn. Some students may prefer short learning sessions. Others may spend longer periods on practical tasks. Some may repeatedly revisit specific topics. Others may move quickly through foundational material.
For EasyShiksha, connecting courses with quizzes, games, projects, and other learning experiences can make the learning journey more engaging and informative. Instead of seeing every feature as a separate destination, the platform can treat each interaction as part of the student's broader development.
Assessment as a Turning Point
Assessment represents an important node in the Student Experience Graph because it can change what happens next.
A quiz is not merely a test at the end of a lesson. It can reveal whether the student has understood a concept, whether additional practice is required, or whether the learner is ready to move forward.
Suppose a student completes a cybersecurity module but performs poorly on a particular concept. In a connected learning environment, that result could influence the next recommended experience. The student might receive additional practice, a simpler explanation, or a related lesson before moving to more advanced material.
Similarly, strong performance could indicate readiness for a practical project.
This transforms assessment from a final measurement into an active part of the learning journey. EasyShiksha's quiz ecosystem can support this philosophy by positioning assessments as meaningful checkpoints within continuous skill development.
The Transition From Knowledge to Practice
One of the most important connections in the Student Experience Graph occurs between learning and application. Knowing a concept does not necessarily mean that a student can use it effectively.
Practical projects create this transition. A student who has studied web development can build a website. A finance learner can analyse financial information. A marketing student can develop a campaign plan. A data science learner can work with a dataset and communicate insights.
The project becomes another node connected to the course and assessment experience.
This creates a richer representation of progress. Instead of recording only that a student completed a course, the graph can represent that the student studied a subject, demonstrated understanding, and applied the knowledge to create something.
For platforms focused on employability, this connection is critical because employers often need evidence of capability rather than evidence of content consumption.
Building the Student's Skill Graph
The Student Experience Graph can eventually become closely connected to a digital skill graph. Every meaningful learning experience can contribute to the development of particular competencies.
A student studying artificial intelligence may gradually develop programming, mathematics, statistics, data processing, machine learning, model evaluation, and problem-solving capabilities. These skills do not exist independently. They form a network.
As the student completes courses, quizzes, projects, and internships, the platform can potentially build a richer understanding of the student's capabilities.
EasyShiksha can use this concept to connect learning experiences with career development. Instead of presenting courses only by subject, the platform can help students understand which skills they are developing and how those skills relate to future opportunities.
This creates a shift from course-centric education to capability-centric education.
The Role of Games and Engagement
Not every student interacts with education in the same way. Engagement can decline when learning becomes repetitive, especially in online environments where students must manage their own attention.
Games and interactive challenges can create additional engagement points within the Student Experience Graph. A quiz can become a challenge, progress can become visible, and learning milestones can become motivating achievements.
However, gamification should support learning rather than distract from it. The purpose is not simply to increase clicks or screen time. Effective educational gamification should encourage students to practise, reflect, solve problems, and progress.
For EasyShiksha, integrating games with courses, quizzes, and practical learning can help create a more dynamic learning environment. A student could move from a lesson to a challenge, from a challenge to a project, and from a project to an internship-oriented experience.
The graph connects these activities into one journey.
The Internship Connection
Internships are a critical stage between education and employment. Yet students frequently experience internships as something separate from their academic learning.
A Student Experience Graph can connect the internship directly to the skills and learning experiences that prepared the student for it.
A student who completes a programming course, performs well in relevant assessments, and builds a software project could receive an internship opportunity related to those capabilities. During the internship, the student could gain additional practical experience that strengthens the same skill areas.
The relationship becomes circular. Learning prepares the student for experience, and experience reveals what the student should learn next.
This is particularly aligned with EasyShiksha's broader Learn, Practise, and Intern approach. The value of an internship becomes greater when it is connected to the learning journey rather than treated as an isolated achievement.
Career Discovery as an Ongoing Interaction
Career decisions are rarely made once. Students frequently change their interests after discovering new subjects, meeting professionals, completing projects, or experiencing internships.
A Student Experience Graph can capture this evolution.
A student may initially express interest in software development but later discover a stronger preference for data analytics. Another may begin with general business studies and eventually become interested in digital marketing. These changes should not necessarily be treated as failures. They can represent learning and self-discovery.
Career guidance can therefore become a continuous process. As the student's experiences accumulate, the platform can help them understand emerging patterns.
EasyShiksha can connect career guidance with courses, quizzes, practical projects, internships, and job preparation so that career exploration becomes an ongoing part of education rather than a single counselling session.
The graph becomes especially valuable when it connects learning experiences with career readiness.
Students often ask whether they are "job ready," but readiness is difficult to measure using course completion alone. A more meaningful picture could consider knowledge, assessment performance, project experience, practical exposure, communication, problem-solving, and relevant professional skills.
The Student Experience Graph can conceptually bring these elements together.
For example, a student may have completed several courses but have limited project experience. Another may have fewer certificates but several strong projects and internship experiences. Their career readiness profiles could therefore be different even if their course counts are similar.
This encourages a more evidence-based approach to student development.
The First Job as a Connected Outcome
The first job is often treated as the final destination of education. In reality, it is another significant node in the student's lifelong learning journey.
When a student receives a first job, the graph can connect the outcome back to the experiences that contributed to it. Which courses were useful? Which projects helped during interviews? Which internship provided relevant exposure? Which skills influenced the hiring decision?
Understanding these connections could help students make better decisions in the future.
It could also help educational platforms understand which learning pathways are associated with meaningful career outcomes, provided that data is collected ethically and interpreted responsibly.
For EasyShiksha, the first-job stage can become part of a larger education-to-employment continuum where learning does not stop when employment begins.
AI as the Intelligence Layer of the Experience Graph
Artificial intelligence could play an important role in analysing the complex relationships within a Student Experience Graph. A student may generate a large number of interactions over several years, making it difficult to understand the overall pattern manually.
AI systems could potentially identify learning gaps, changing interests, repeated difficulties, emerging strengths, and potential career pathways. The objective would be to support students with relevant recommendations rather than simply provide more content.
For example, if a student repeatedly demonstrates strong performance in analytical tasks and develops interest in finance, an AI-supported system could suggest relevant courses, projects, internships, or career paths.
However, AI recommendations should remain supportive rather than deterministic. Students are not data patterns alone. Personal interests, circumstances, creativity, motivation, and human relationships also influence career decisions.
The most effective Education Experience Graph would therefore combine computational intelligence with human guidance.
Personalisation Through Context
Personalisation becomes more powerful when it understands context. A student who has completed ten courses is not automatically more advanced than someone who has completed three. The relevance of those courses, assessment performance, project quality, practical experience, and career goals all matter.
A Student Experience Graph provides the conceptual foundation for contextual personalisation.
Instead of recommending the next course solely based on what a student clicked, the system could consider the student's broader journey. If the learner's goal is employment in data analytics and they already possess foundational knowledge, the next recommendation could focus on practical analysis, portfolio development, or internship preparation.
This makes personalisation less about predicting clicks and more about supporting progress.
Creating a Living Student Profile
The Student Experience Graph can eventually become the foundation of a living student profile. Unlike a traditional resume or transcript, this profile can evolve continuously.
It can contain academic learning, online courses, quizzes, projects, internships, certificates, skills, interests, and career experiences. The student can use selected parts of this profile when applying for universities, internships, scholarships, or jobs.
This approach also reduces the burden of repeatedly rebuilding educational histories.
A student's profile becomes an evolving representation of development rather than a document created only when an application is due.
For EasyShiksha, such a model could connect its educational ecosystem into a more persistent learning identity, allowing students to see how individual experiences contribute to larger goals.
Privacy and Student Ownership
The Student Experience Graph also raises important questions about privacy. Mapping every interaction can be valuable for personalisation, but not every interaction should automatically become part of a permanent record.
Students should understand what information is collected, how it is used, and which organisations can access it. They should have meaningful control over the information shared with universities, internship providers, employers, or other services.
There is also a distinction between useful educational data and unnecessary surveillance. A responsible platform should collect information because it contributes to learning or student support, not simply because technology makes collection possible.
The graph should ultimately belong to the student's educational interests, with privacy, transparency, security, and consent built into its design.
One of the biggest risks in designing an experience graph is treating every digital action as equally important. A student clicking on a course does not necessarily indicate meaningful learning. Spending more time on a page does not automatically mean greater engagement. Completing more quizzes does not always mean deeper understanding.
The purpose of the Student Experience Graph should therefore be to identify meaningful relationships rather than simply accumulate activity data.
A completed project, successful assessment, reflective decision, internship experience, or demonstrated skill can carry greater educational significance than hundreds of clicks.
The graph should therefore evolve from an activity map into a learning and development map.
Frequently Asked Questions
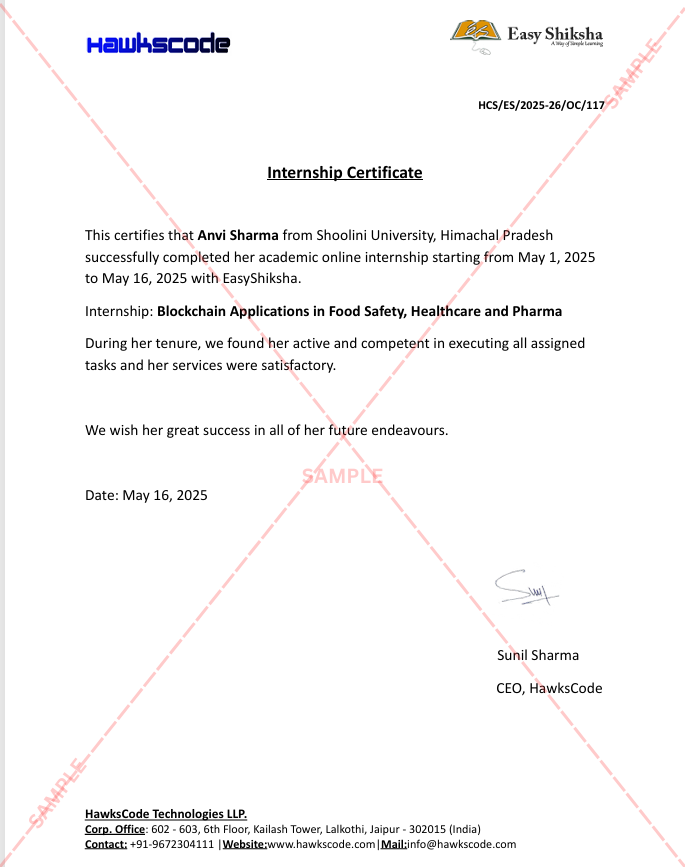
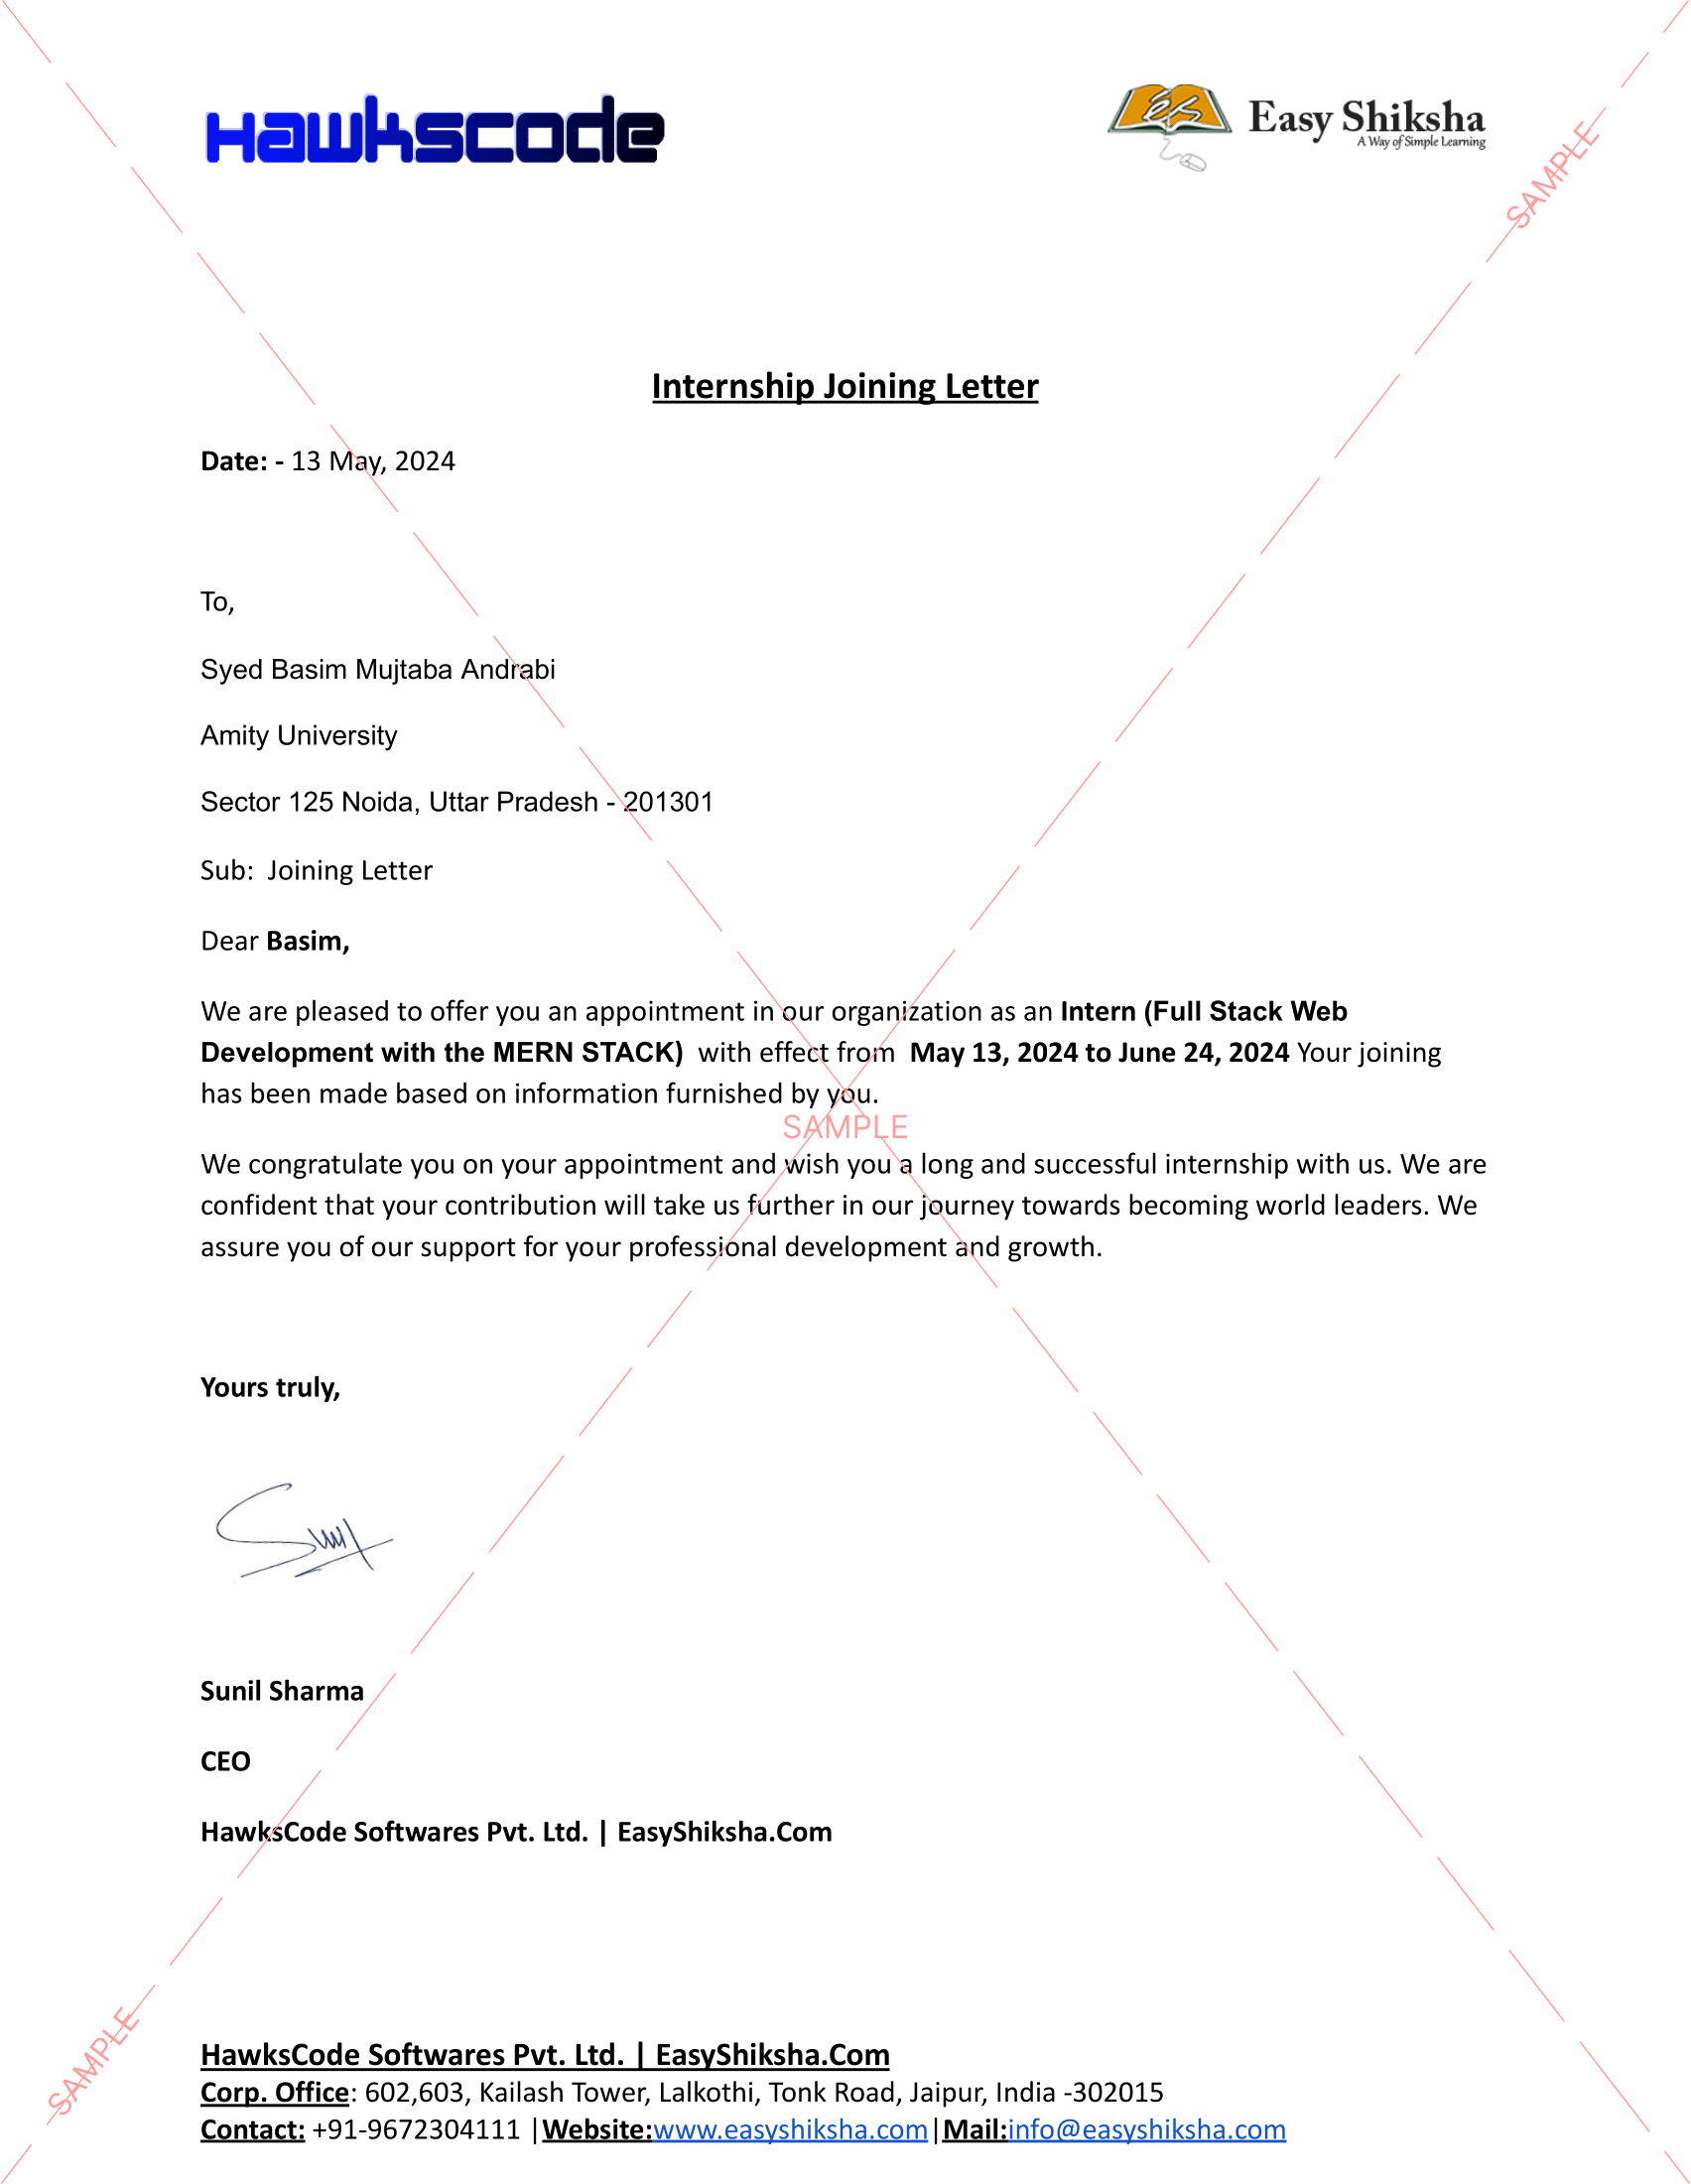
Q. How can I apply for an internship with EasyShiksha?
You can apply by visiting our website, browsing available internships, and following the application instructions provided.
Q. What types of internships are available through EasyShiksha?
EasyShiksha offers a wide range of internships across technology, business, marketing, healthcare, and more.
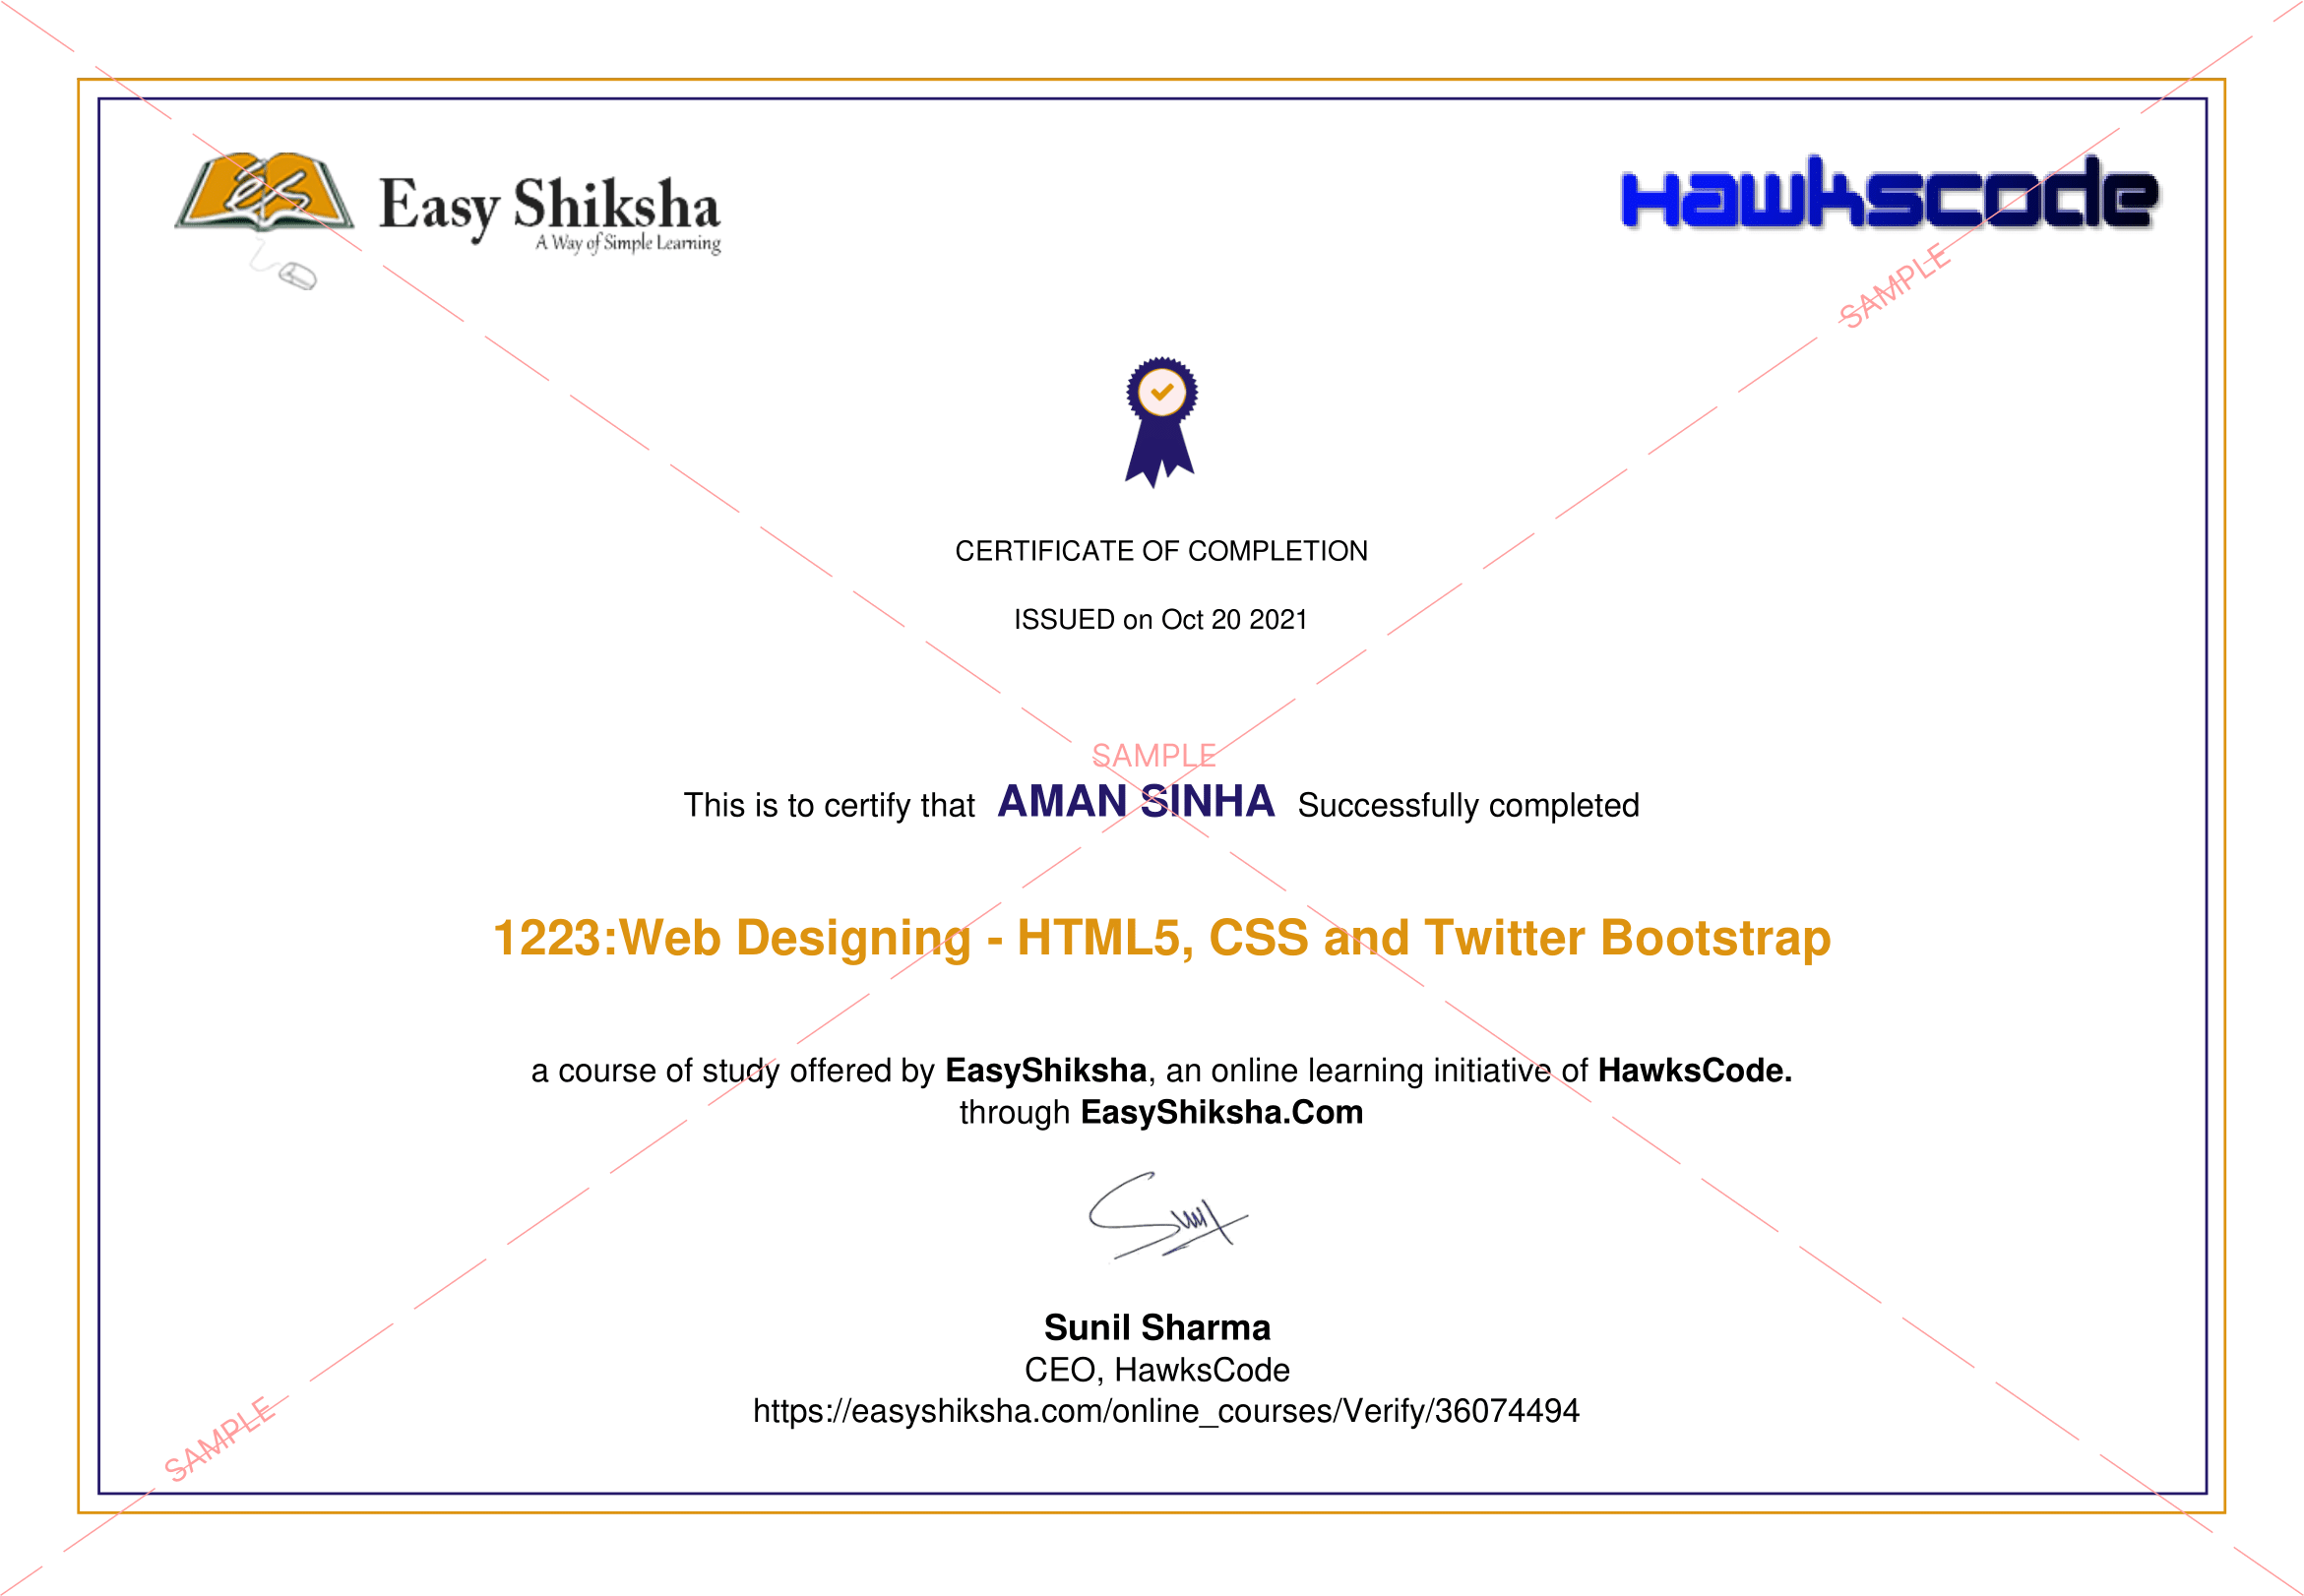
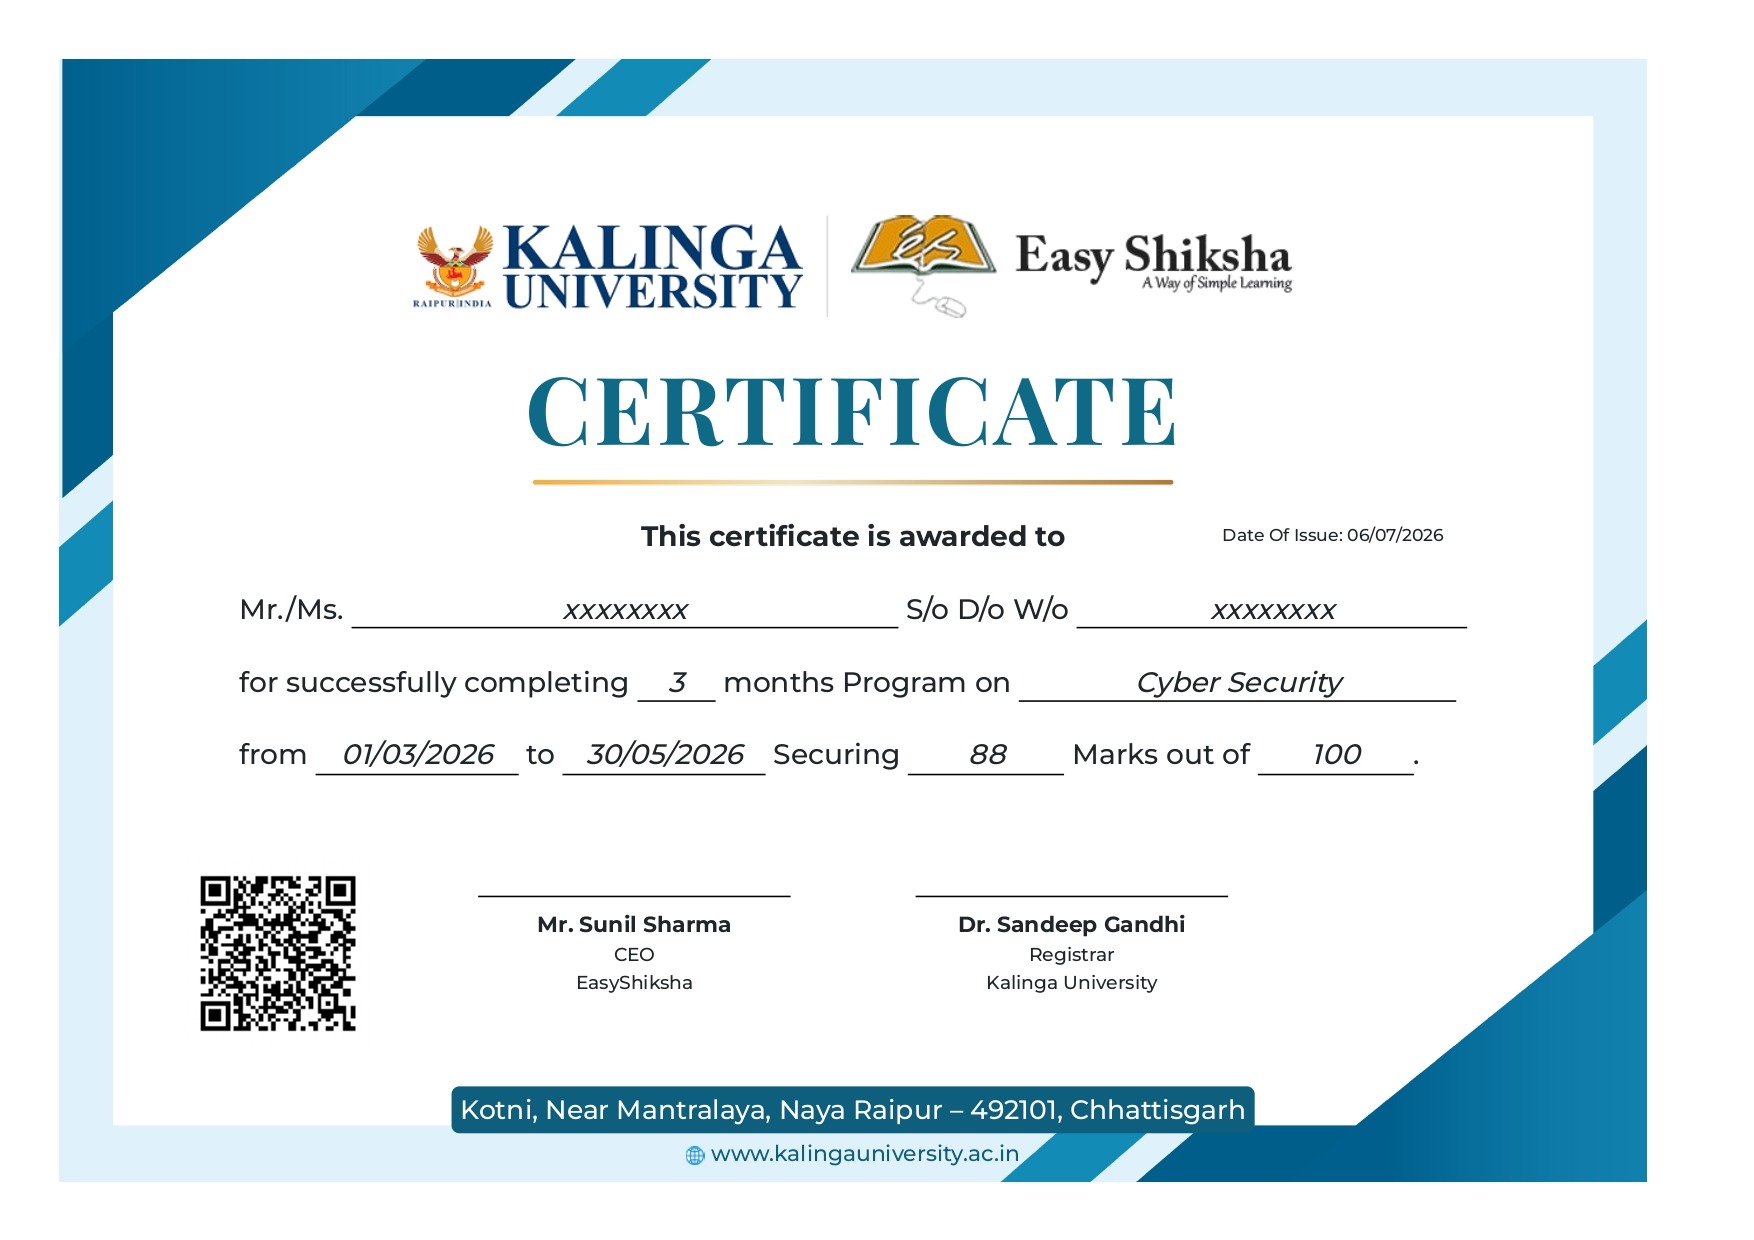
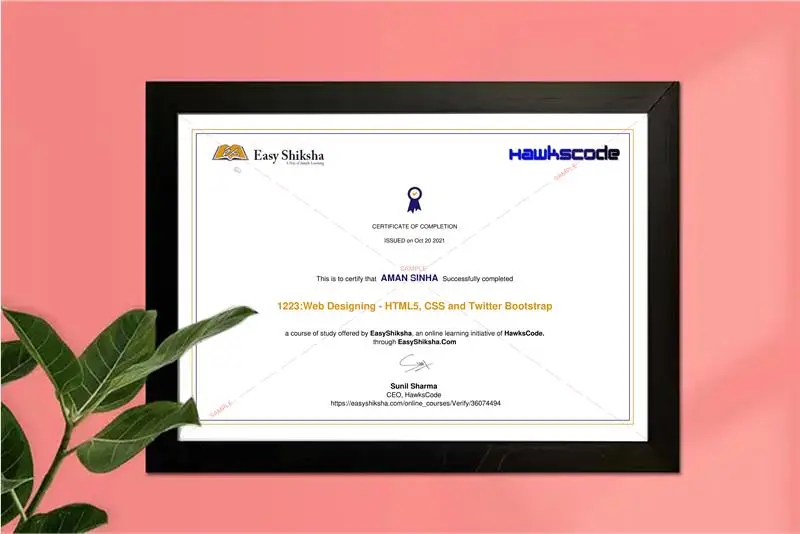
Q. Will I receive a certificate upon completing an internship?
Yes, upon successful completion, you will receive a certificate recognizing your participation and achievements.
Q. Are EasyShiksha's certificates recognized?
Yes, the certificates are recognized by universities, colleges, and employers worldwide.
Q. When can I start the course?
You can choose any course and start immediately without delay.
Q. What are the course and session timings?
These are fully online courses. You can learn at any time and pace that fits your schedule.
Q. What will happen when my course is over?
After completion, you will have lifetime access to the course for future reference.
Q. Can I download the notes and study material?
Yes, you can access and download course materials and have lifetime access for future reference.
Q. What software/tools would be needed?
All necessary software/tools will be shared during the training as needed.
Q. I’m unable to make a payment. What should I do?
Try using a different card. If the problem persists, email us at info@easyshiksha.com.
Q. Do I get the certificate in hard copy?
No, only a soft copy is provided, which can be downloaded and printed if required.
Q. The payment got deducted but shows “failed”?
The deducted amount will be returned to your account in 7-10 working days automatically.
Q. Payment successful but dashboard shows ‘Buy Now’?
Reflection may take 30 mins. If longer, email info@easyshiksha.com with your screenshot.
Q. What is the refund policy?
Refunds are available for technical issues. No refunds once a certificate is generated.
Q. Can I enroll in a single course?
Yes, select any course, complete the details, and start learning immediately.
Q. Need further help?
Contact us at info@easyshiksha.com for any other questions.
From Student Experience Graph to Education Operating System
The Student Experience Graph can also become a foundational component of a broader Education Operating System.
An Education Operating System connects courses, assessments, projects, internships, credentials, career guidance, universities, and employment opportunities. The Student Experience Graph provides the contextual layer showing how the student moves through those components.
Together, these concepts create a vision of education as connected infrastructure.
The platform does not simply deliver content. It understands where the learner has been, what they have learned, what they have demonstrated, where they may want to go, and what experiences could help them move forward.
EasyShiksha's ecosystem of courses, quizzes, internships, certificates, games, university opportunities, and career guidance can be viewed through this larger framework. Each component becomes a connected stage rather than an isolated feature.
The Future of the First-Job Journey
The transition from first course discovery to first job may become increasingly digital, but the future should not be about making students follow an automated path.
Instead, the goal should be to create greater visibility.
A student should be able to understand why they are learning something, what skill it develops, how they can practise it, where they can gain experience, and which career opportunities may value that capability.
The platform should help students see the connections between their decisions.
When these relationships become visible, education becomes easier to navigate. Students can identify gaps before they become obstacles. They can recognise strengths earlier. They can explore career alternatives with greater confidence. They can build evidence of capability throughout their journey rather than attempting to prove everything at the end.
This is where the Student Experience Graph can have its greatest value.
Conclusion: Mapping the Journey, Not Just Measuring Completion
The Student Experience Graph represents a fundamental change in how digital education can understand the learner. Instead of reducing education to course enrolments, grades, certificates, and final outcomes, it recognises that student development is shaped by a network of interactions.
The journey begins with discovery. It continues through exploration, decision-making, learning, assessment, practice, projects, engagement, internships, career discovery, skill development, and eventually the first job. Each stage influences the next, while the student's goals and interests can evolve throughout the process.
For EasyShiksha, this approach creates an opportunity to connect its diverse educational experiences into a more meaningful student journey. Courses can introduce knowledge, quizzes can provide feedback, games can encourage engagement, projects can demonstrate application, internships can provide practical exposure, certificates can document achievement, and career guidance can connect learning with professional possibilities.
Anshika Jain is an Engineer, Developer, and Educational Content Author known for her dedication to technology and knowledge sharing. With a strong analytical mindset and a passion for innovation, she has consistently contributed to creating meaningful digital solutions and insightful educational articles.
Her ability to simplify complex technical concepts into engaging and easy-to-understand content makes her work valuable for students and learners across various platforms. Along with her technical expertise, Anshika is admired for her creativity, professionalism, and commitment to continuous learning.
She represents a perfect blend of technical excellence and impactful communication, inspiring others through both her development work and educational contributions.