


Statistics meaning, Collection and Presentation of Data
Develop core skills in collecting, organizing, and presenting data to analyze information and make informed decisions confidently.
#1 Most Popular Online Course & Internship in Math You can enroll today & get certified from EasyShiksha & HawksCode.
 Build real-world projects
Internship with certificate
Resume-ready experience
Beginner to advanced
Lifetime access
Interview prep included
Build real-world projects
Internship with certificate
Resume-ready experience
Beginner to advanced
Lifetime access
Interview prep included
 Updated April 27, 2026
Join 5,00,000+ students already enrolled worldwide
No risk — 30-day full refund guarantee
Start instantly after payment — access in seconds
Certificate + Internship Joining Letter included
Updated April 27, 2026
Join 5,00,000+ students already enrolled worldwide
No risk — 30-day full refund guarantee
Start instantly after payment — access in seconds
Certificate + Internship Joining Letter included
 Free Preview
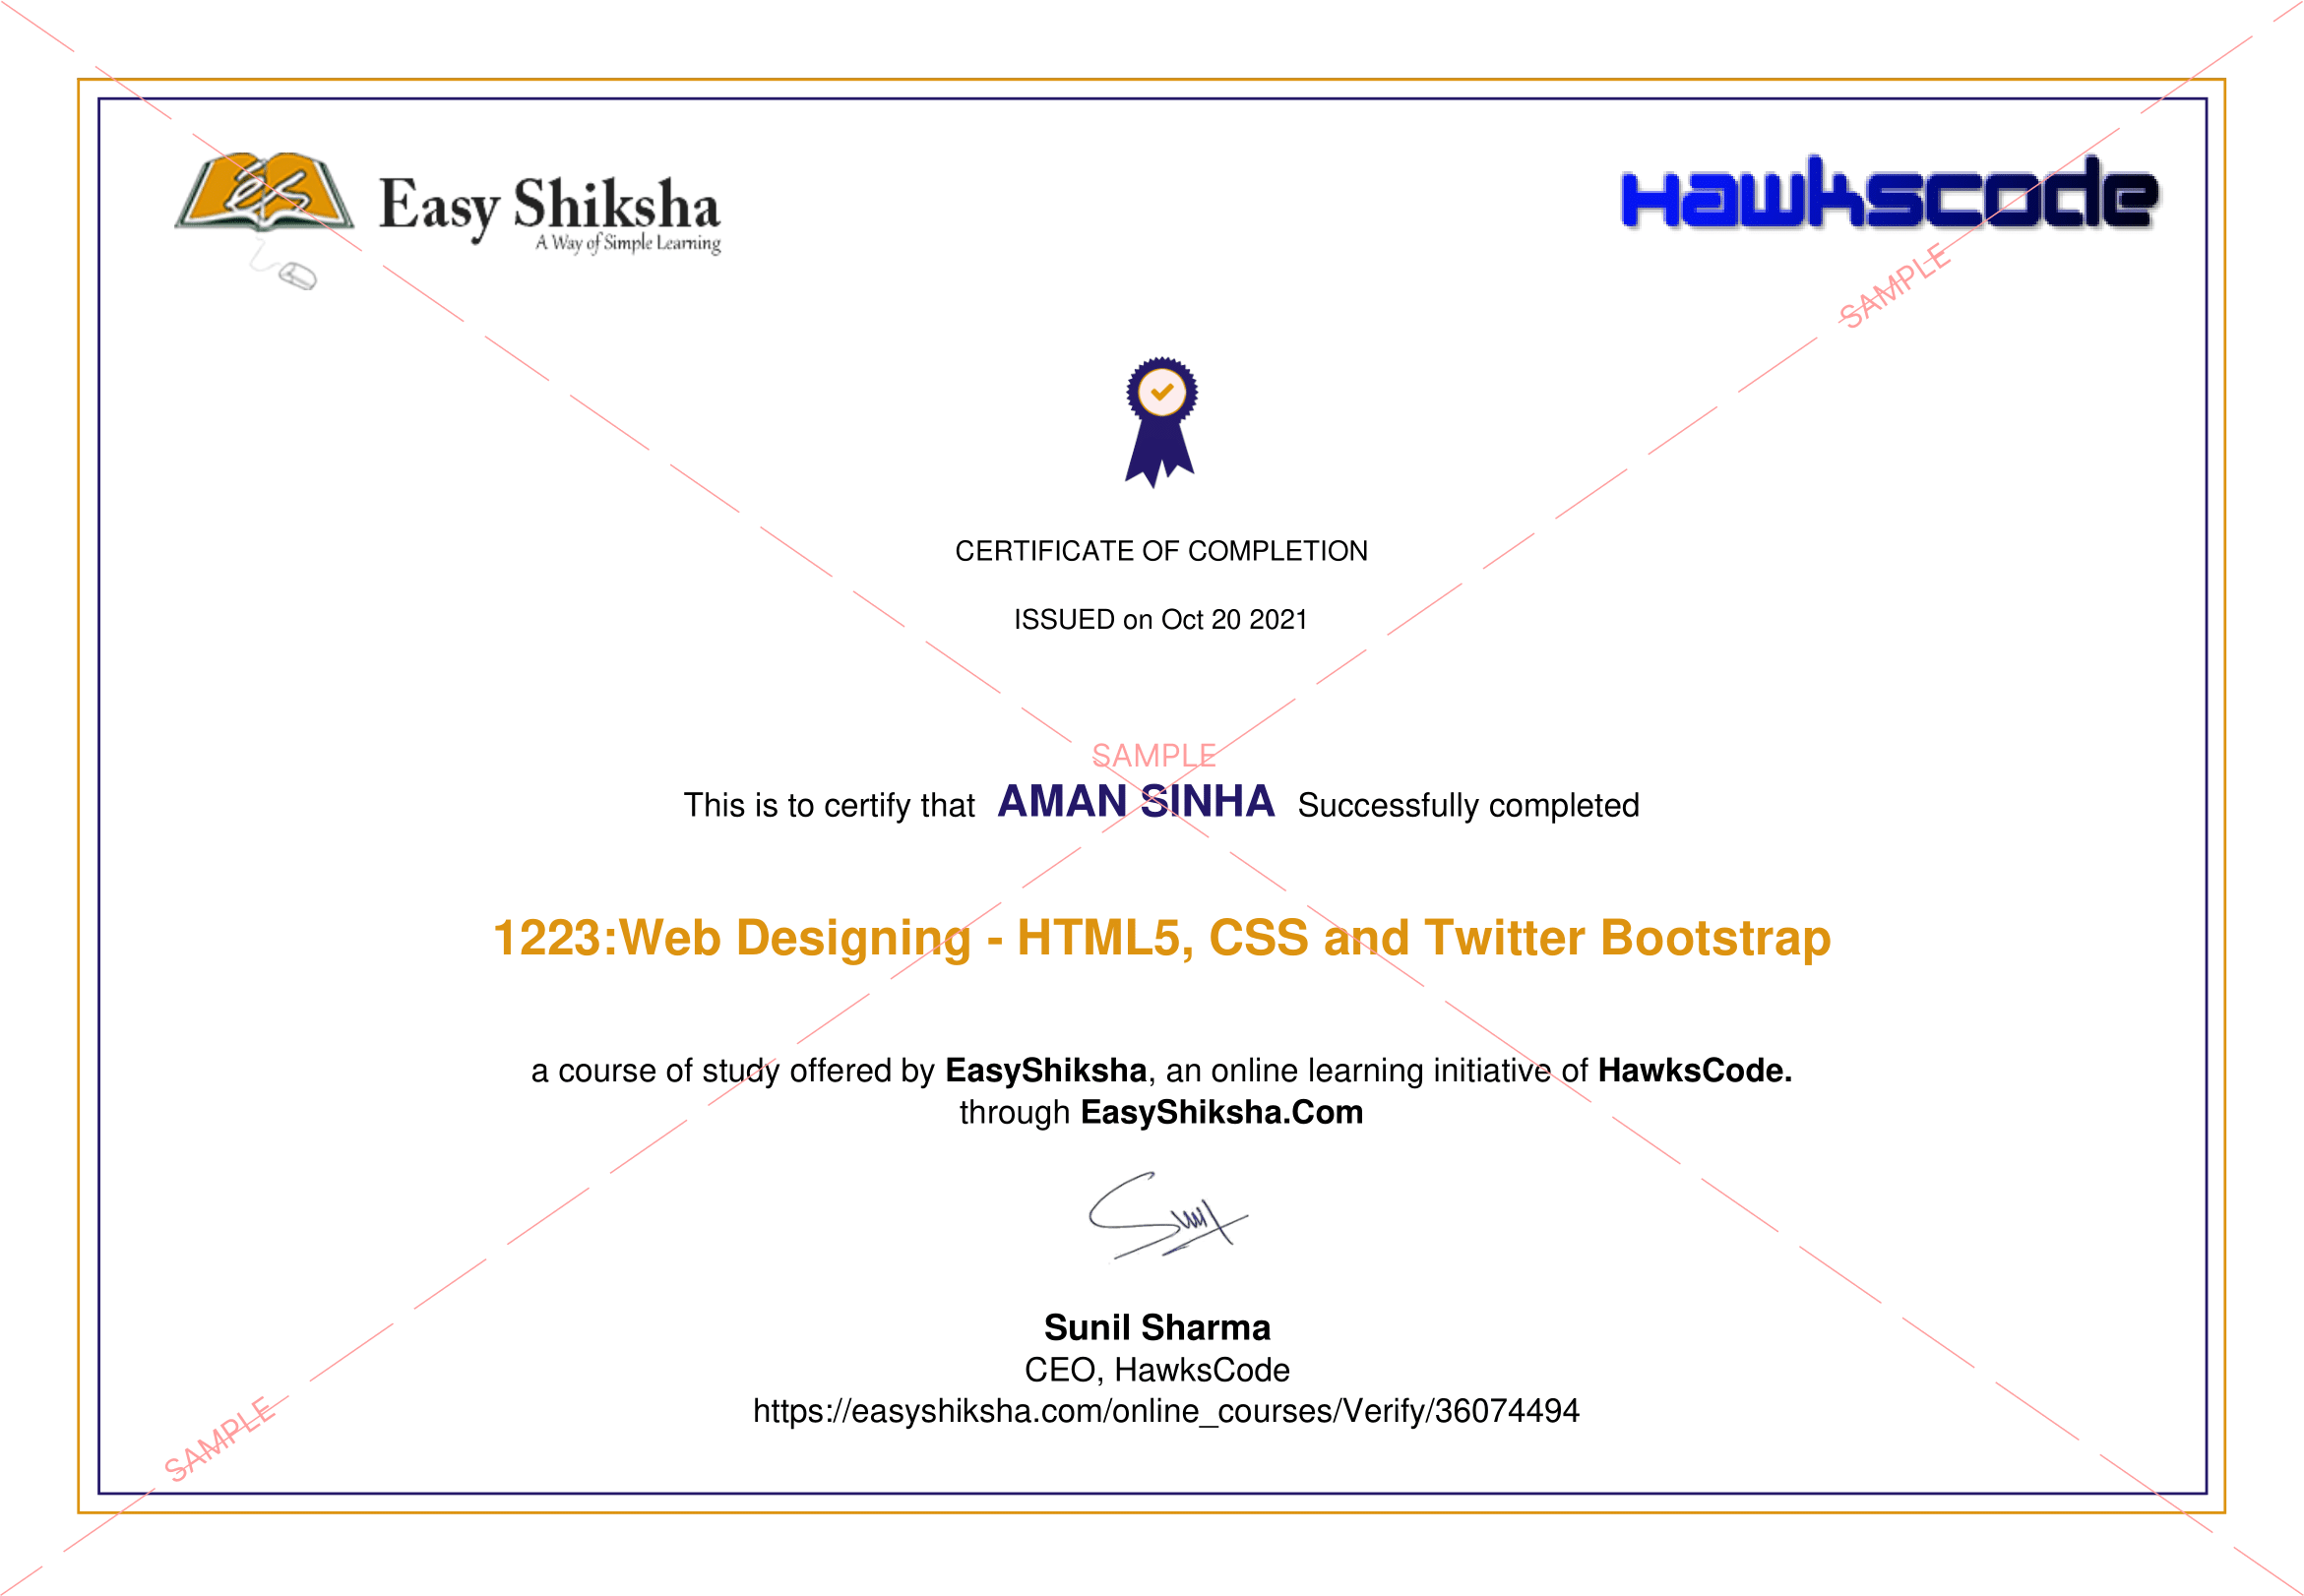 5 On-demand Videos
 Internship Joining Letter
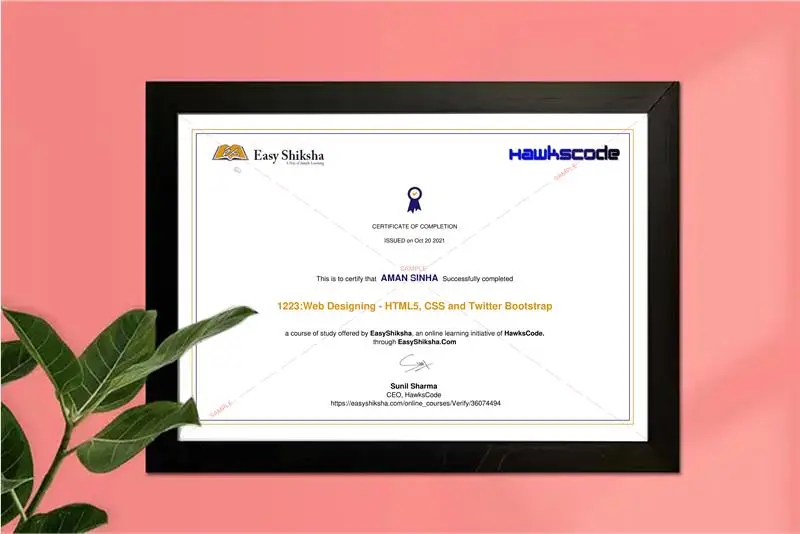
 2 Certificates (Course + Internship)
 Lifetime Access
 Mobile & Desktop Access
Why This Course and Internship Stands Out
See exactly what separates EasyShiksha students from everyone else
 Watching scattered YouTube
videos with no structure
No certificate — nothing to show
employers
No internship experience on
resume
Wasting months without clear
direction
Struggling to stand out in job
applications
No proof of practical skills
Structured, beginner-to-advanced
learning path
Verified certificate — shareable
on LinkedIn
Real internship offer letter for
your resume
Go from zero to job-ready in one
programme
Resume-ready experience before
graduation
Practical projects you can show
any recruiter
Watching scattered YouTube
videos with no structure
No certificate — nothing to show
employers
No internship experience on
resume
Wasting months without clear
direction
Struggling to stand out in job
applications
No proof of practical skills
Structured, beginner-to-advanced
learning path
Verified certificate — shareable
on LinkedIn
Real internship offer letter for
your resume
Go from zero to job-ready in one
programme
Resume-ready experience before
graduation
Practical projects you can show
any recruiter
Internship Opportunity Included With This Course
"This is not just a course — it's real career experience. Walk away with documents that prove your skills to any employer."
This Course is Perfect For
Whether you're starting from scratch or switching careers — this course is designed with your success in mind.
Foundations of Data and Statistics: Understanding, Collecting, and Presenting Information
This course offers a solid foundation in how we gather, interpret, and use information in everyday life. We begin by recognizing that information surrounds us constantly—whether in the form of facts, figures, tables, or graphs—and explore what “data” truly means. You will be introduced to statistics as the branch of mathematics dedicated to making sense of data, and discover the various meanings behind the term “statistics” itself.
To deepen your understanding, you’ll be invited to identify and collect five examples of data from your own daily experiences.
Next, we will differentiate between primary data—collected firsthand through surveys, experiments, and observations—and secondary data—gathered from existing sources like government reports, research journals, and online databases. You’ll learn the advantages and disadvantages of each type and why understanding these differences is vital in any data-related work.
Once data is collected, organizing and presenting it becomes essential. The course explains the importance of data presentation and why simply listing data in order isn’t always effective. You will learn how to create ungrouped frequency distribution tables to neatly organize raw data, and progress to grouped frequency distribution tables, with clear examples to guide you. Through practical exercises, such as adjusting grouped tables to include new data points, you’ll develop hands-on skills in data handling.
Finally, we highlight the broad relevance of statistics across fields like business, healthcare, social sciences, and engineering. By understanding data and statistical methods, you’ll be better equipped to make informed decisions in both professional and personal contexts.
This course will empower you to confidently navigate our data-rich world with fundamental skills in data collection, analysis, and presentation.


 Missing this = losing the internship credential Missing this = losing your early-access advantage Missing this = falling behind candidates who did enroll
 Chat with us first → 5 On-demand Videos Course Completion Certificate
Internship Certificate
Internship Joining/Offer Letter
Letter of Appreciation (LOA)
Internship Attendance Report
Internship Evaluation Report
Internship Certificate Hard Copy
Project Report Assitance
Internship Project Assitance
1:1 Live Mentor Call
Course Certificate in Elegant Wooden Frame
2 Certificates (Course + Internship) Lifetime Access Projects & Assignments
Chat with us first → 5 On-demand Videos Course Completion Certificate
Internship Certificate
Internship Joining/Offer Letter
Letter of Appreciation (LOA)
Internship Attendance Report
Internship Evaluation Report
Internship Certificate Hard Copy
Project Report Assitance
Internship Project Assitance
1:1 Live Mentor Call
Course Certificate in Elegant Wooden Frame
2 Certificates (Course + Internship) Lifetime Access Projects & AssignmentsWhy Start Now?
The Opportunity Won’t Wait.
Every day you delay is a missed opportunity to grow your skills. Learners who start today gain the advantage — whether it's building skills, improving careers, or unlocking new opportunities.
Still Thinking?
Here's everything that makes this a no-brainer:
No prior experience needed — start from absolute zero Beginner friendly — explained step by step Risk-free — 30-day full refund guarantee One-time payment — access forever Student-friendly pricing — see details at checkout Real internship certificate includedWhat Happens After You Enroll?
From payment to certificate — here's exactly what to expect
Imagine After Completing This Course
Picture yourself 30 days from now — with skills, experience, and credentials that open real doors.
 Includes Internship