


Statistics Applied Mathematics Class 11-College Math
Learn to visualize, analyze, and interpret data using graphs, central tendency, and dispersion to make informed, quantitative decisions.
#1 Most Popular Online Course & Internship in Math You can enroll today & get certified from EasyShiksha & HawksCode.
 Build real-world projects
Internship with certificate
Resume-ready experience
Beginner to advanced
Lifetime access
Interview prep included
Build real-world projects
Internship with certificate
Resume-ready experience
Beginner to advanced
Lifetime access
Interview prep included
 Updated June 08, 2026
Join 5,00,000+ students already enrolled worldwide
No risk — 30-day full refund guarantee
Start instantly after payment — access in seconds
Certificate + Internship Joining Letter included
Updated June 08, 2026
Join 5,00,000+ students already enrolled worldwide
No risk — 30-day full refund guarantee
Start instantly after payment — access in seconds
Certificate + Internship Joining Letter included

 Free Preview
 4 On-demand Videos
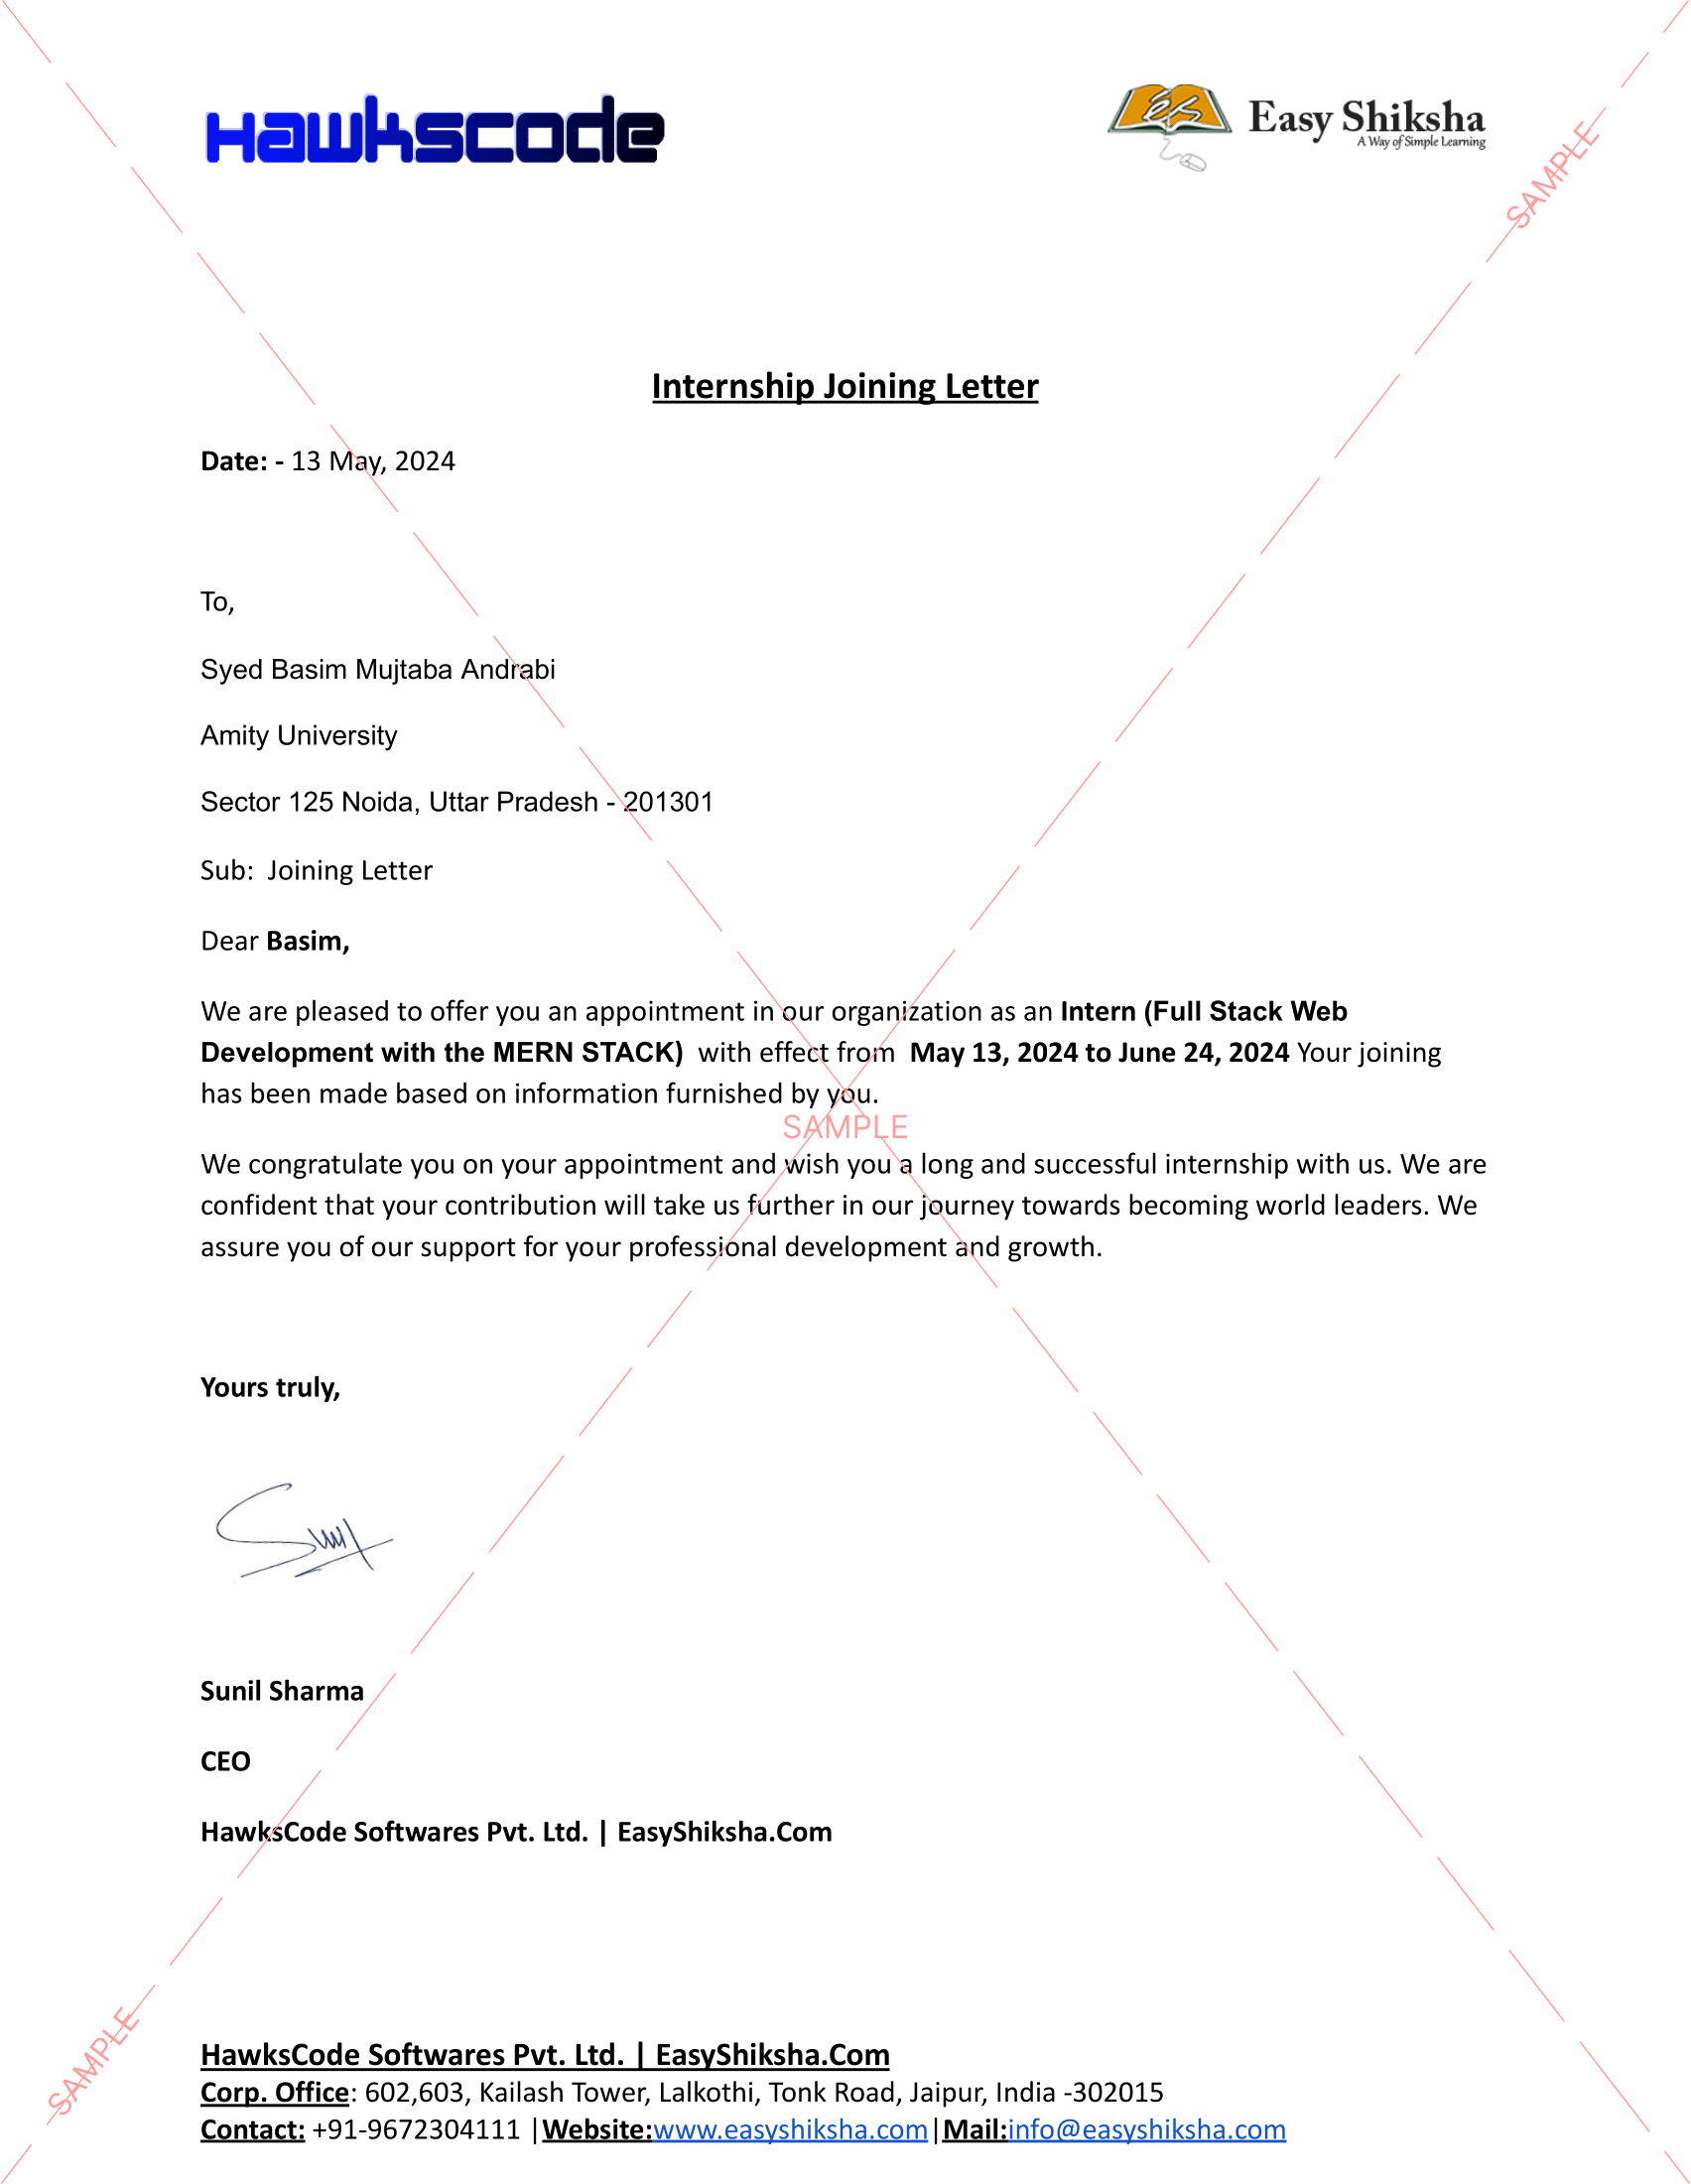
 Internship Joining Letter
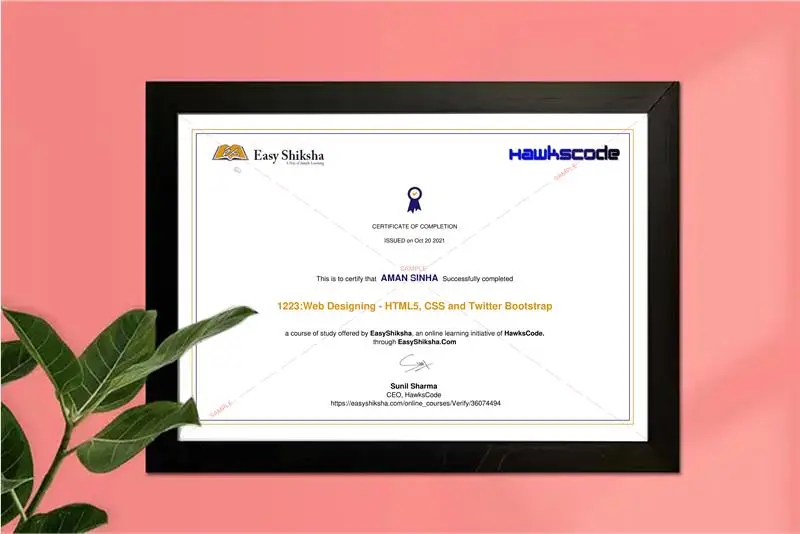
 2 Certificates (Course + Internship)
 Lifetime Access
 Mobile & Desktop Access
Why This Course and Internship Stands Out
See exactly what separates EasyShiksha students from everyone else
 Watching scattered YouTube
videos with no structure
No certificate — nothing to show
employers
No internship experience on
resume
Wasting months without clear
direction
Struggling to stand out in job
applications
No proof of practical skills
Structured, beginner-to-advanced
learning path
Verified certificate — shareable
on LinkedIn
Real internship offer letter for
your resume
Go from zero to job-ready in one
programme
Resume-ready experience before
graduation
Practical projects you can show
any recruiter
Watching scattered YouTube
videos with no structure
No certificate — nothing to show
employers
No internship experience on
resume
Wasting months without clear
direction
Struggling to stand out in job
applications
No proof of practical skills
Structured, beginner-to-advanced
learning path
Verified certificate — shareable
on LinkedIn
Real internship offer letter for
your resume
Go from zero to job-ready in one
programme
Resume-ready experience before
graduation
Practical projects you can show
any recruiter
Internship Opportunity Included With This Course
"This is not just a course — it's real career experience. Walk away with documents that prove your skills to any employer."
This Course is Perfect For
Whether you're starting from scratch or switching careers — this course is designed with your success in mind.
What is Statistics?
Statistics is a branch of Mathematics dealing with the collection, organisation ,representation and interpretation of data.
This course deals with the graphical representation of data, measures of Central tendency: Mean ,Median and Mode and Measures of Dispersion : Mean Deviation and Standard Deviation.
Statistical data can be easily understood if we represent it in the form of diagrams and graphs. Here, we study the following types of graphs: Pie Charts, Bar graphs, Histograms, Frequency Polygons.You will learn how to draw these graphs and interpret them. These form an integral part of quantitative aptitude tests.
Statistical data has the tendency to cluster around a central value. This is called Central tendency. The different ways of measuring Central tendency are Mean, Median and Mode. You will learn how to calculate these for grouped and ungrouped data,
You are introduced to Quartiles and how to calculate them using the formula.
In order to interpret the data, you should know how data is spread around a central value.This leads to measures of dispersion, namely mean deviation and standard deviation.
You will learn about Mean Deviation about the mean and mean deviation about the median for discrete and continuous frequency distributions.You move on to learning variance and standard deviation. Three methods of calculating the standard deviation are discussed.
Join me in my next course on calculating moments, skewness, Correlation !
Missing this = losing the internship credential Missing this = losing your early-access advantage Missing this = falling behind candidates who did enroll
 Chat with us first → 4 On-demand Videos Course Completion Certificate
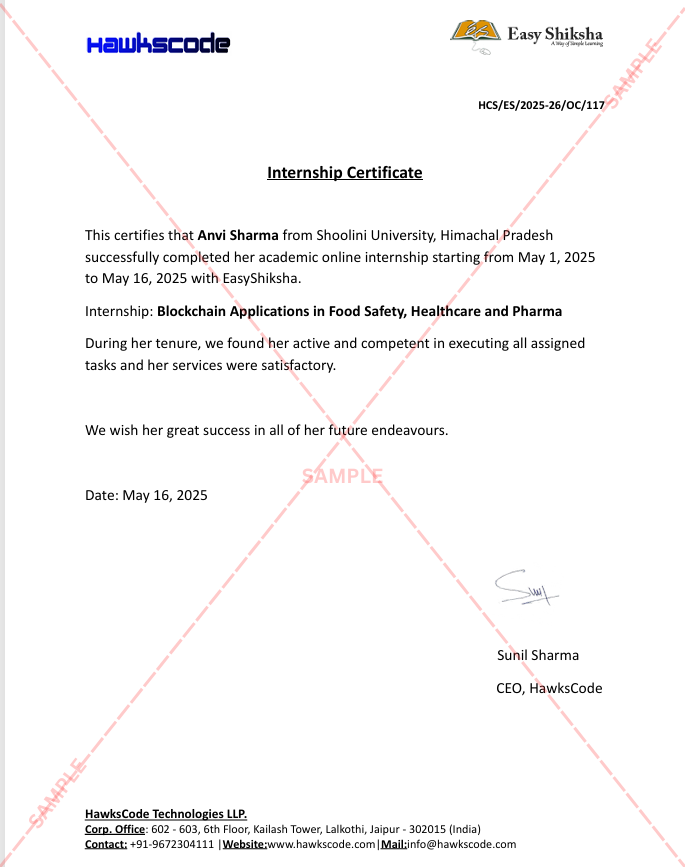
Internship Certificate
Internship Joining/Offer Letter
Letter of Appreciation (LOA)
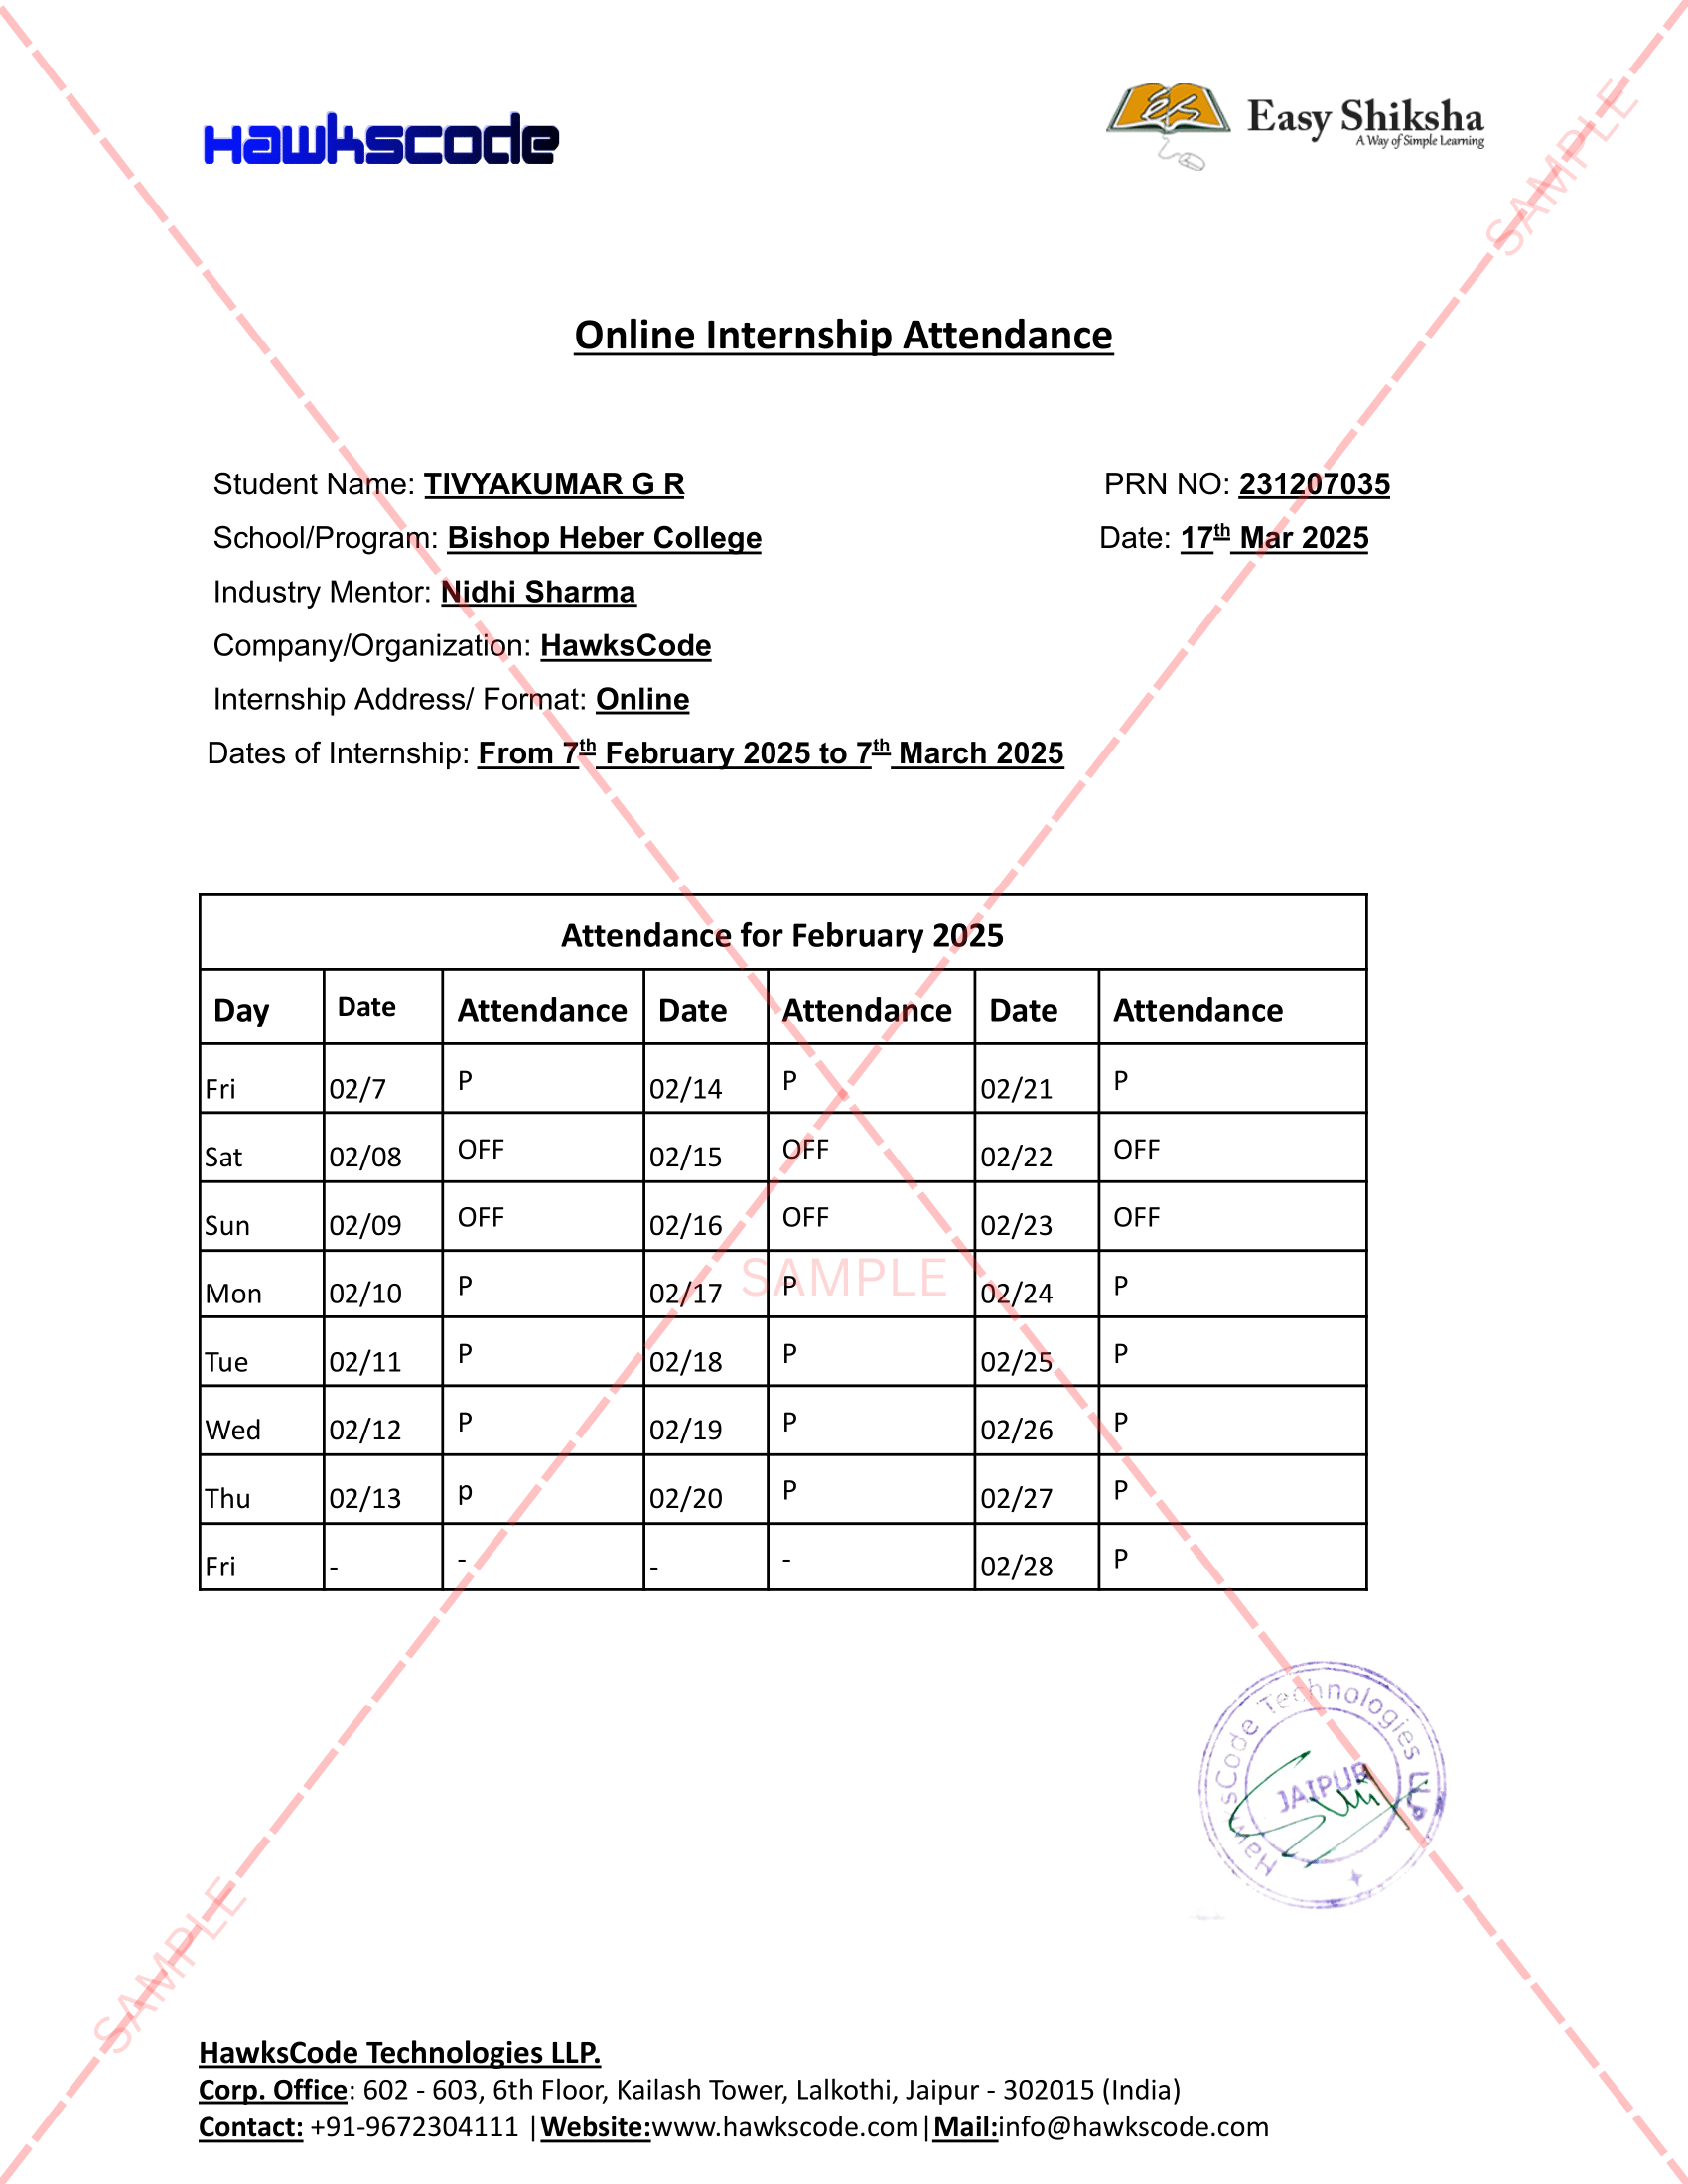
Internship Attendance Report
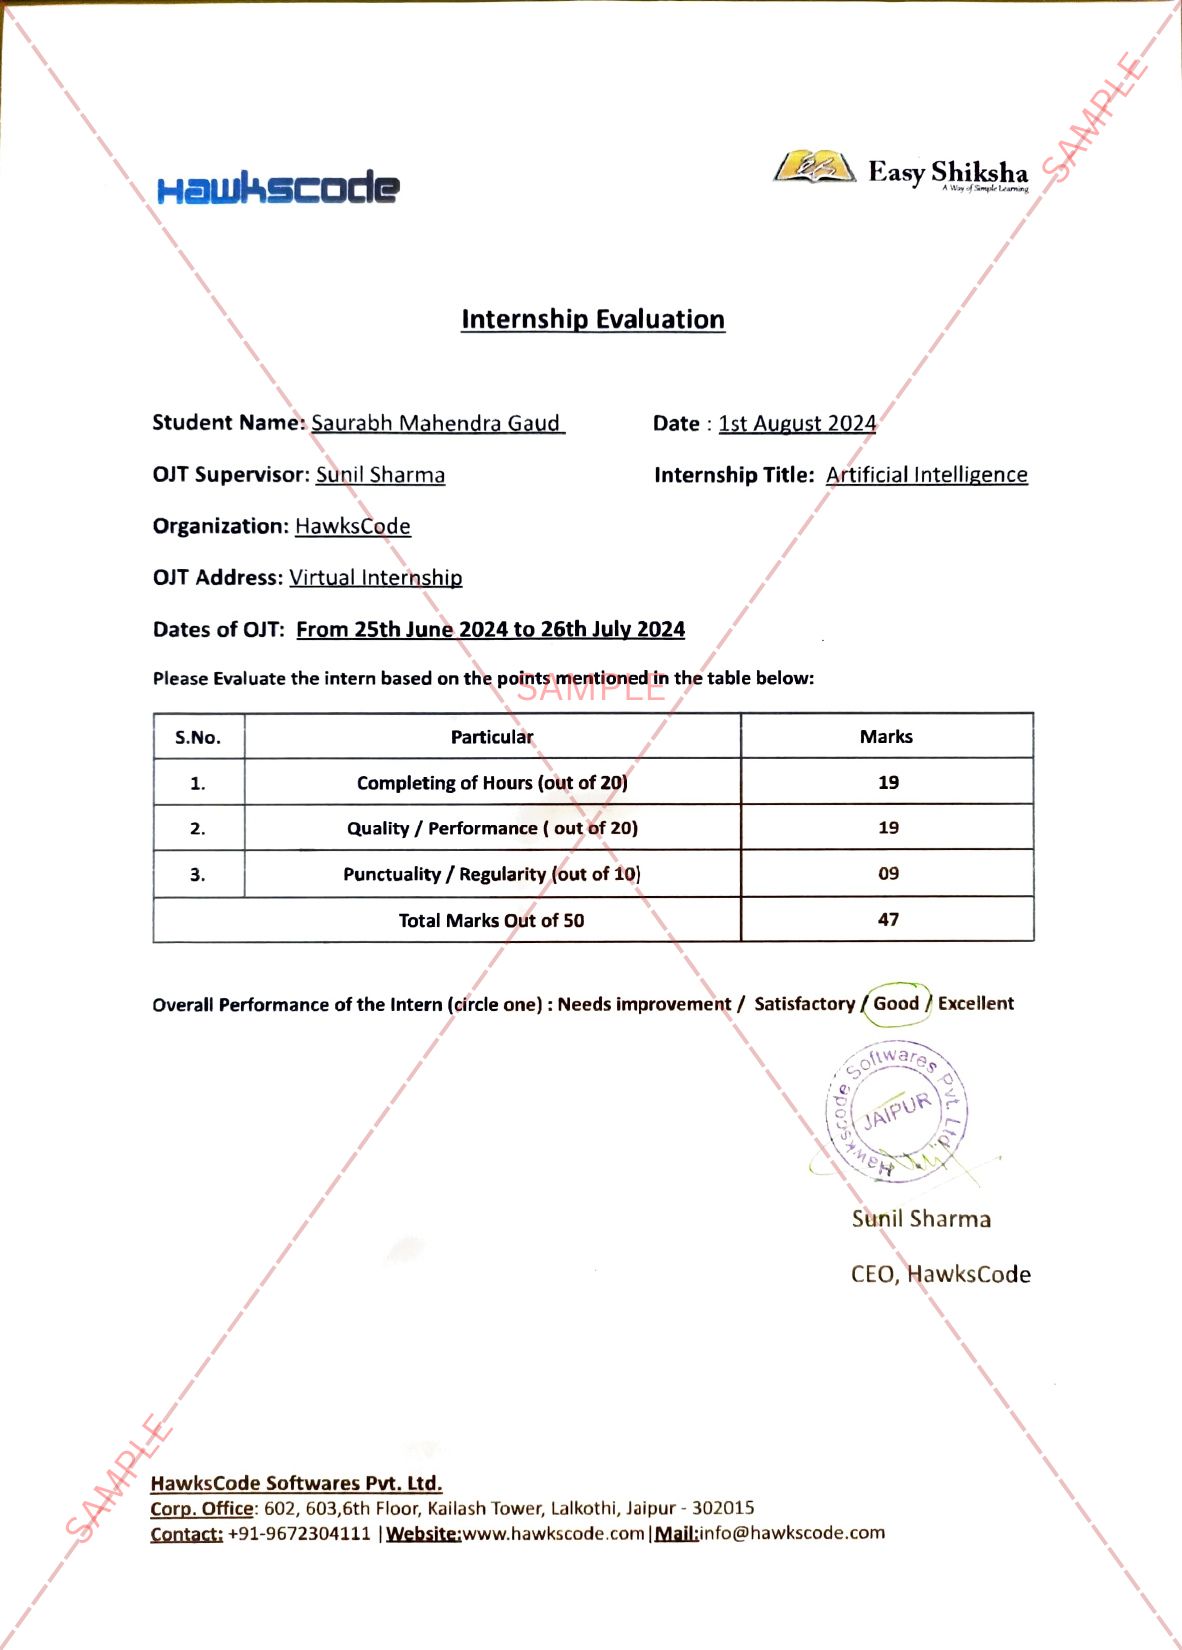
Internship Evaluation Report
Internship Certificate Hard Copy
Project Report Assitance
Internship Project Assitance
1:1 Live Mentor Call
Course Certificate in Elegant Wooden Frame
2 Certificates (Course + Internship) Lifetime Access Projects & Assignments
Chat with us first → 4 On-demand Videos Course Completion Certificate
Internship Certificate
Internship Joining/Offer Letter
Letter of Appreciation (LOA)
Internship Attendance Report
Internship Evaluation Report
Internship Certificate Hard Copy
Project Report Assitance
Internship Project Assitance
1:1 Live Mentor Call
Course Certificate in Elegant Wooden Frame
2 Certificates (Course + Internship) Lifetime Access Projects & AssignmentsWhy Start Now?
The Opportunity Won’t Wait.
Every day you delay is a missed opportunity to grow your skills. Learners who start today gain the advantage — whether it's building skills, improving careers, or unlocking new opportunities.
Still Thinking?
Here's everything that makes this a no-brainer:
No prior experience needed — start from absolute zero Beginner friendly — explained step by step Risk-free — 30-day full refund guarantee One-time payment — access forever Student-friendly pricing — see details at checkout Real internship certificate includedWhat Happens After You Enroll?
From payment to certificate — here's exactly what to expect
Imagine After Completing This Course
Picture yourself 30 days from now — with skills, experience, and credentials that open real doors.
 Includes Internship