


Introduction to Histogram and frequency polygon from theory to practice
Master histograms and frequency polygons to visualize, compare, and interpret data accurately for effective analysis and decision-making.
#1 Most Popular Online Course & Internship in Math You can enroll today & get certified from EasyShiksha & HawksCode.
 Build real-world projects
Internship with certificate
Resume-ready experience
Beginner to advanced
Lifetime access
Interview prep included
Build real-world projects
Internship with certificate
Resume-ready experience
Beginner to advanced
Lifetime access
Interview prep included
 Updated June 29, 2026
Join 5,00,000+ students already enrolled worldwide
No risk — 30-day full refund guarantee
Start instantly after payment — access in seconds
Certificate + Internship Joining Letter included
Updated June 29, 2026
Join 5,00,000+ students already enrolled worldwide
No risk — 30-day full refund guarantee
Start instantly after payment — access in seconds
Certificate + Internship Joining Letter included
 Free Preview
 5 On-demand Videos
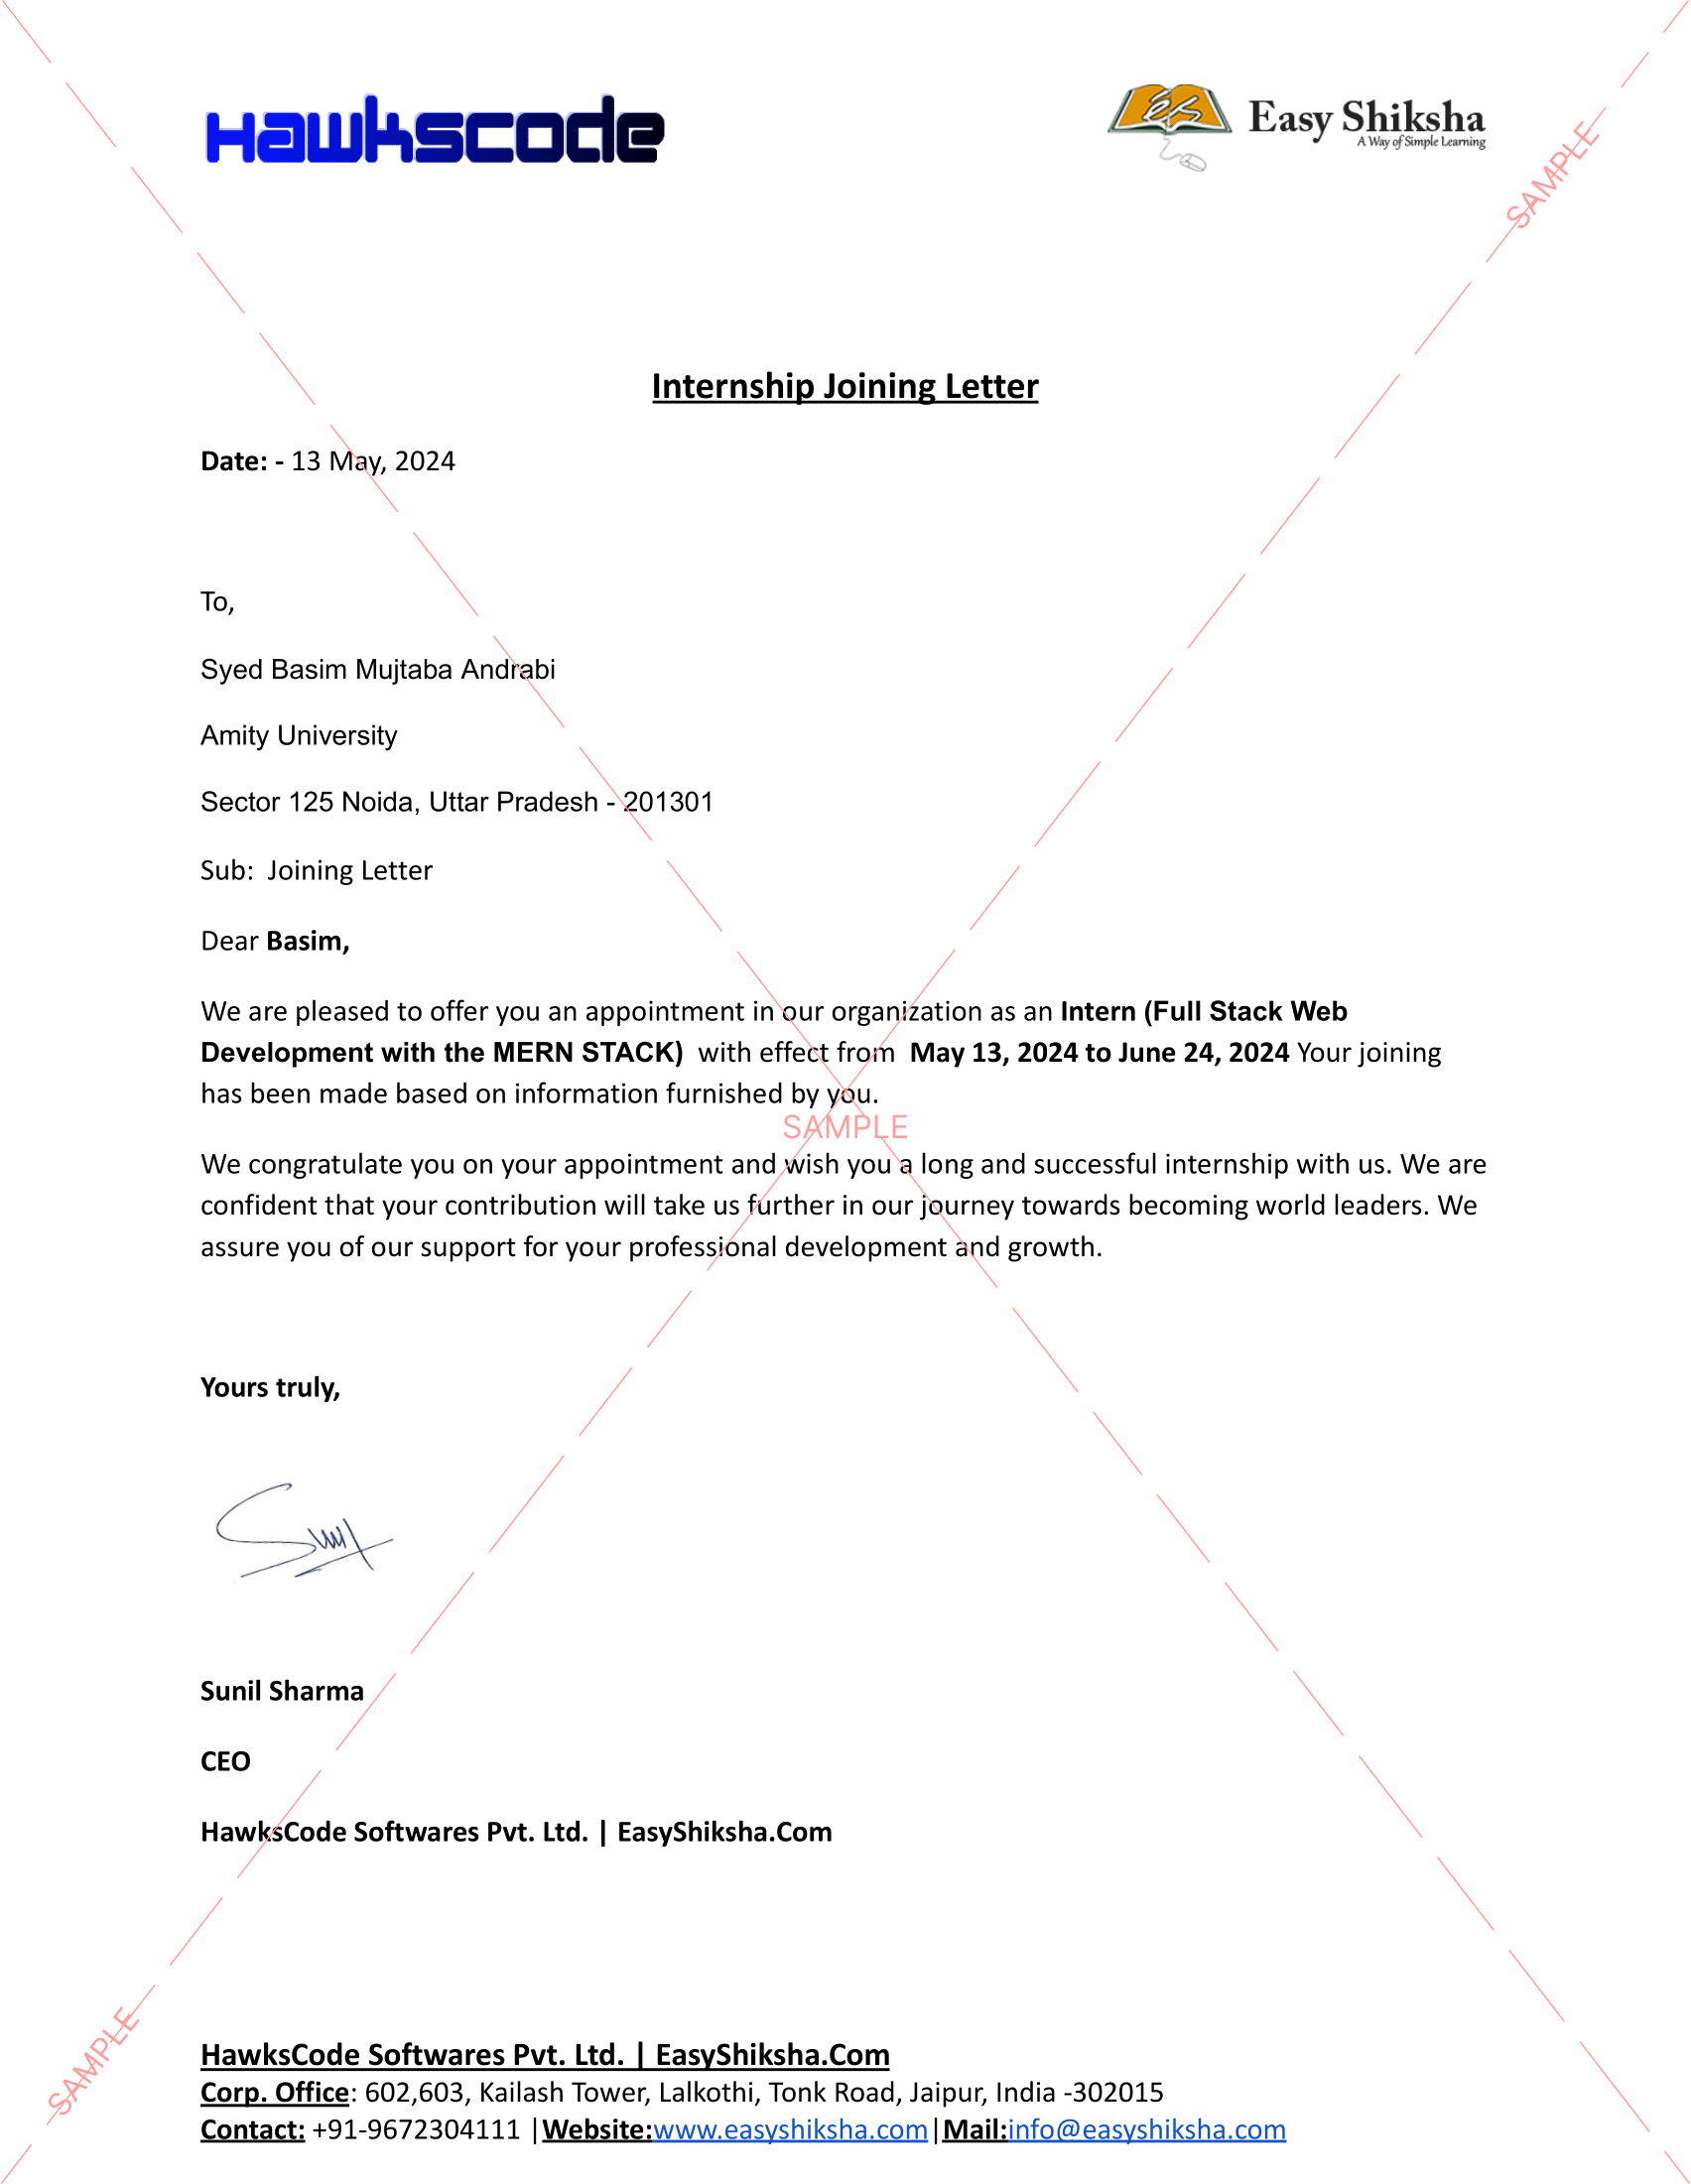
 Internship Joining Letter
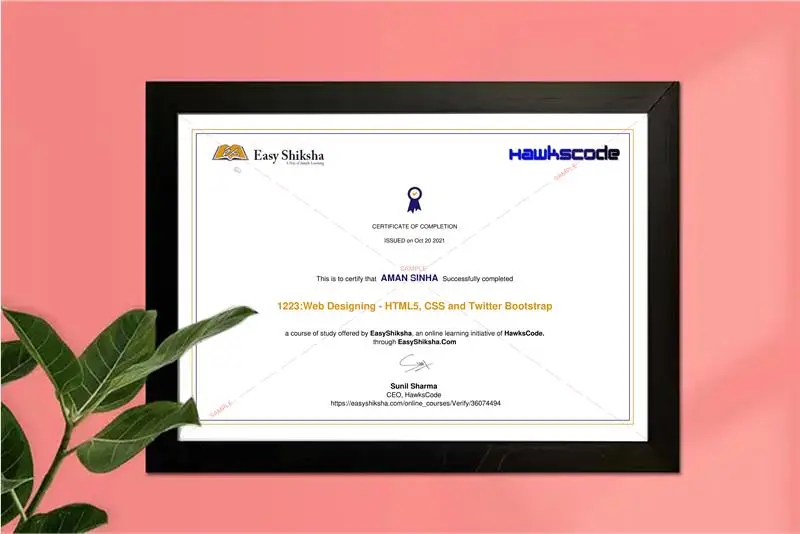
 2 Certificates (Course + Internship)
 Lifetime Access
 Mobile & Desktop Access
Why This Course and Internship Stands Out
See exactly what separates EasyShiksha students from everyone else
 Watching scattered YouTube
videos with no structure
No certificate — nothing to show
employers
No internship experience on
resume
Wasting months without clear
direction
Struggling to stand out in job
applications
No proof of practical skills
Structured, beginner-to-advanced
learning path
Verified certificate — shareable
on LinkedIn
Real internship offer letter for
your resume
Go from zero to job-ready in one
programme
Resume-ready experience before
graduation
Practical projects you can show
any recruiter
Watching scattered YouTube
videos with no structure
No certificate — nothing to show
employers
No internship experience on
resume
Wasting months without clear
direction
Struggling to stand out in job
applications
No proof of practical skills
Structured, beginner-to-advanced
learning path
Verified certificate — shareable
on LinkedIn
Real internship offer letter for
your resume
Go from zero to job-ready in one
programme
Resume-ready experience before
graduation
Practical projects you can show
any recruiter
Internship Opportunity Included With This Course
"This is not just a course — it's real career experience. Walk away with documents that prove your skills to any employer."
This Course is Perfect For
Whether you're starting from scratch or switching careers — this course is designed with your success in mind.
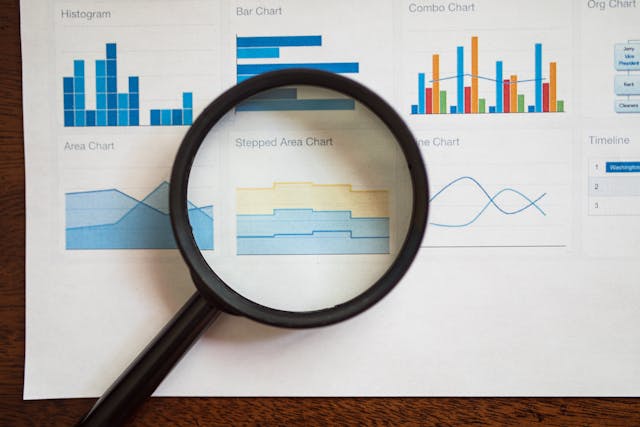
Graphical Data Representation: Mastering Histograms and Frequency Polygons
This course offers a thorough exploration of important graphical tools used in data analysis—specifically histograms and frequency polygons. We’ll start with a real-life example where measurements of plant leaf lengths are recorded in a table with discontinuous class intervals. You’ll learn how to convert such data into continuous class intervals, a crucial step to accurately build a histogram.
We’ll also discuss when a histogram is the best choice and when other charts, like frequency polygons, might provide clearer insights depending on the data. Using practical examples, such as the lifetimes of neon lamps, you’ll practice creating histograms and learn how to interpret them—for example, figuring out how many lamps last longer than a certain number of hours.
The course also covers how to compare data sets visually. For instance, you’ll see how to plot two frequency polygons on the same graph to compare the distribution of student marks from two different sections.
To build a strong foundation, we’ll explain key terms related to grouped data—like class intervals, class size, and class limits—and clarify the different data needs for histograms versus frequency polygons.
By the end, you’ll be confident in selecting and creating the right graphical representations to effectively display and analyze a wide range of data sets.
Missing this = losing the internship credential Missing this = losing your early-access advantage Missing this = falling behind candidates who did enroll
 Chat with us first → 5 On-demand Videos Course Completion Certificate
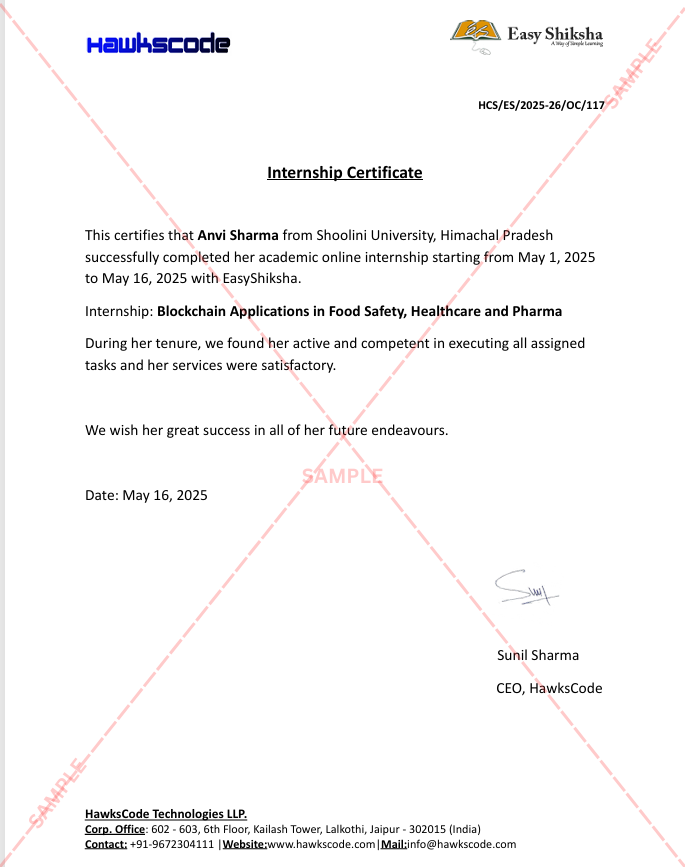
Internship Certificate
Internship Joining/Offer Letter
Letter of Appreciation (LOA)
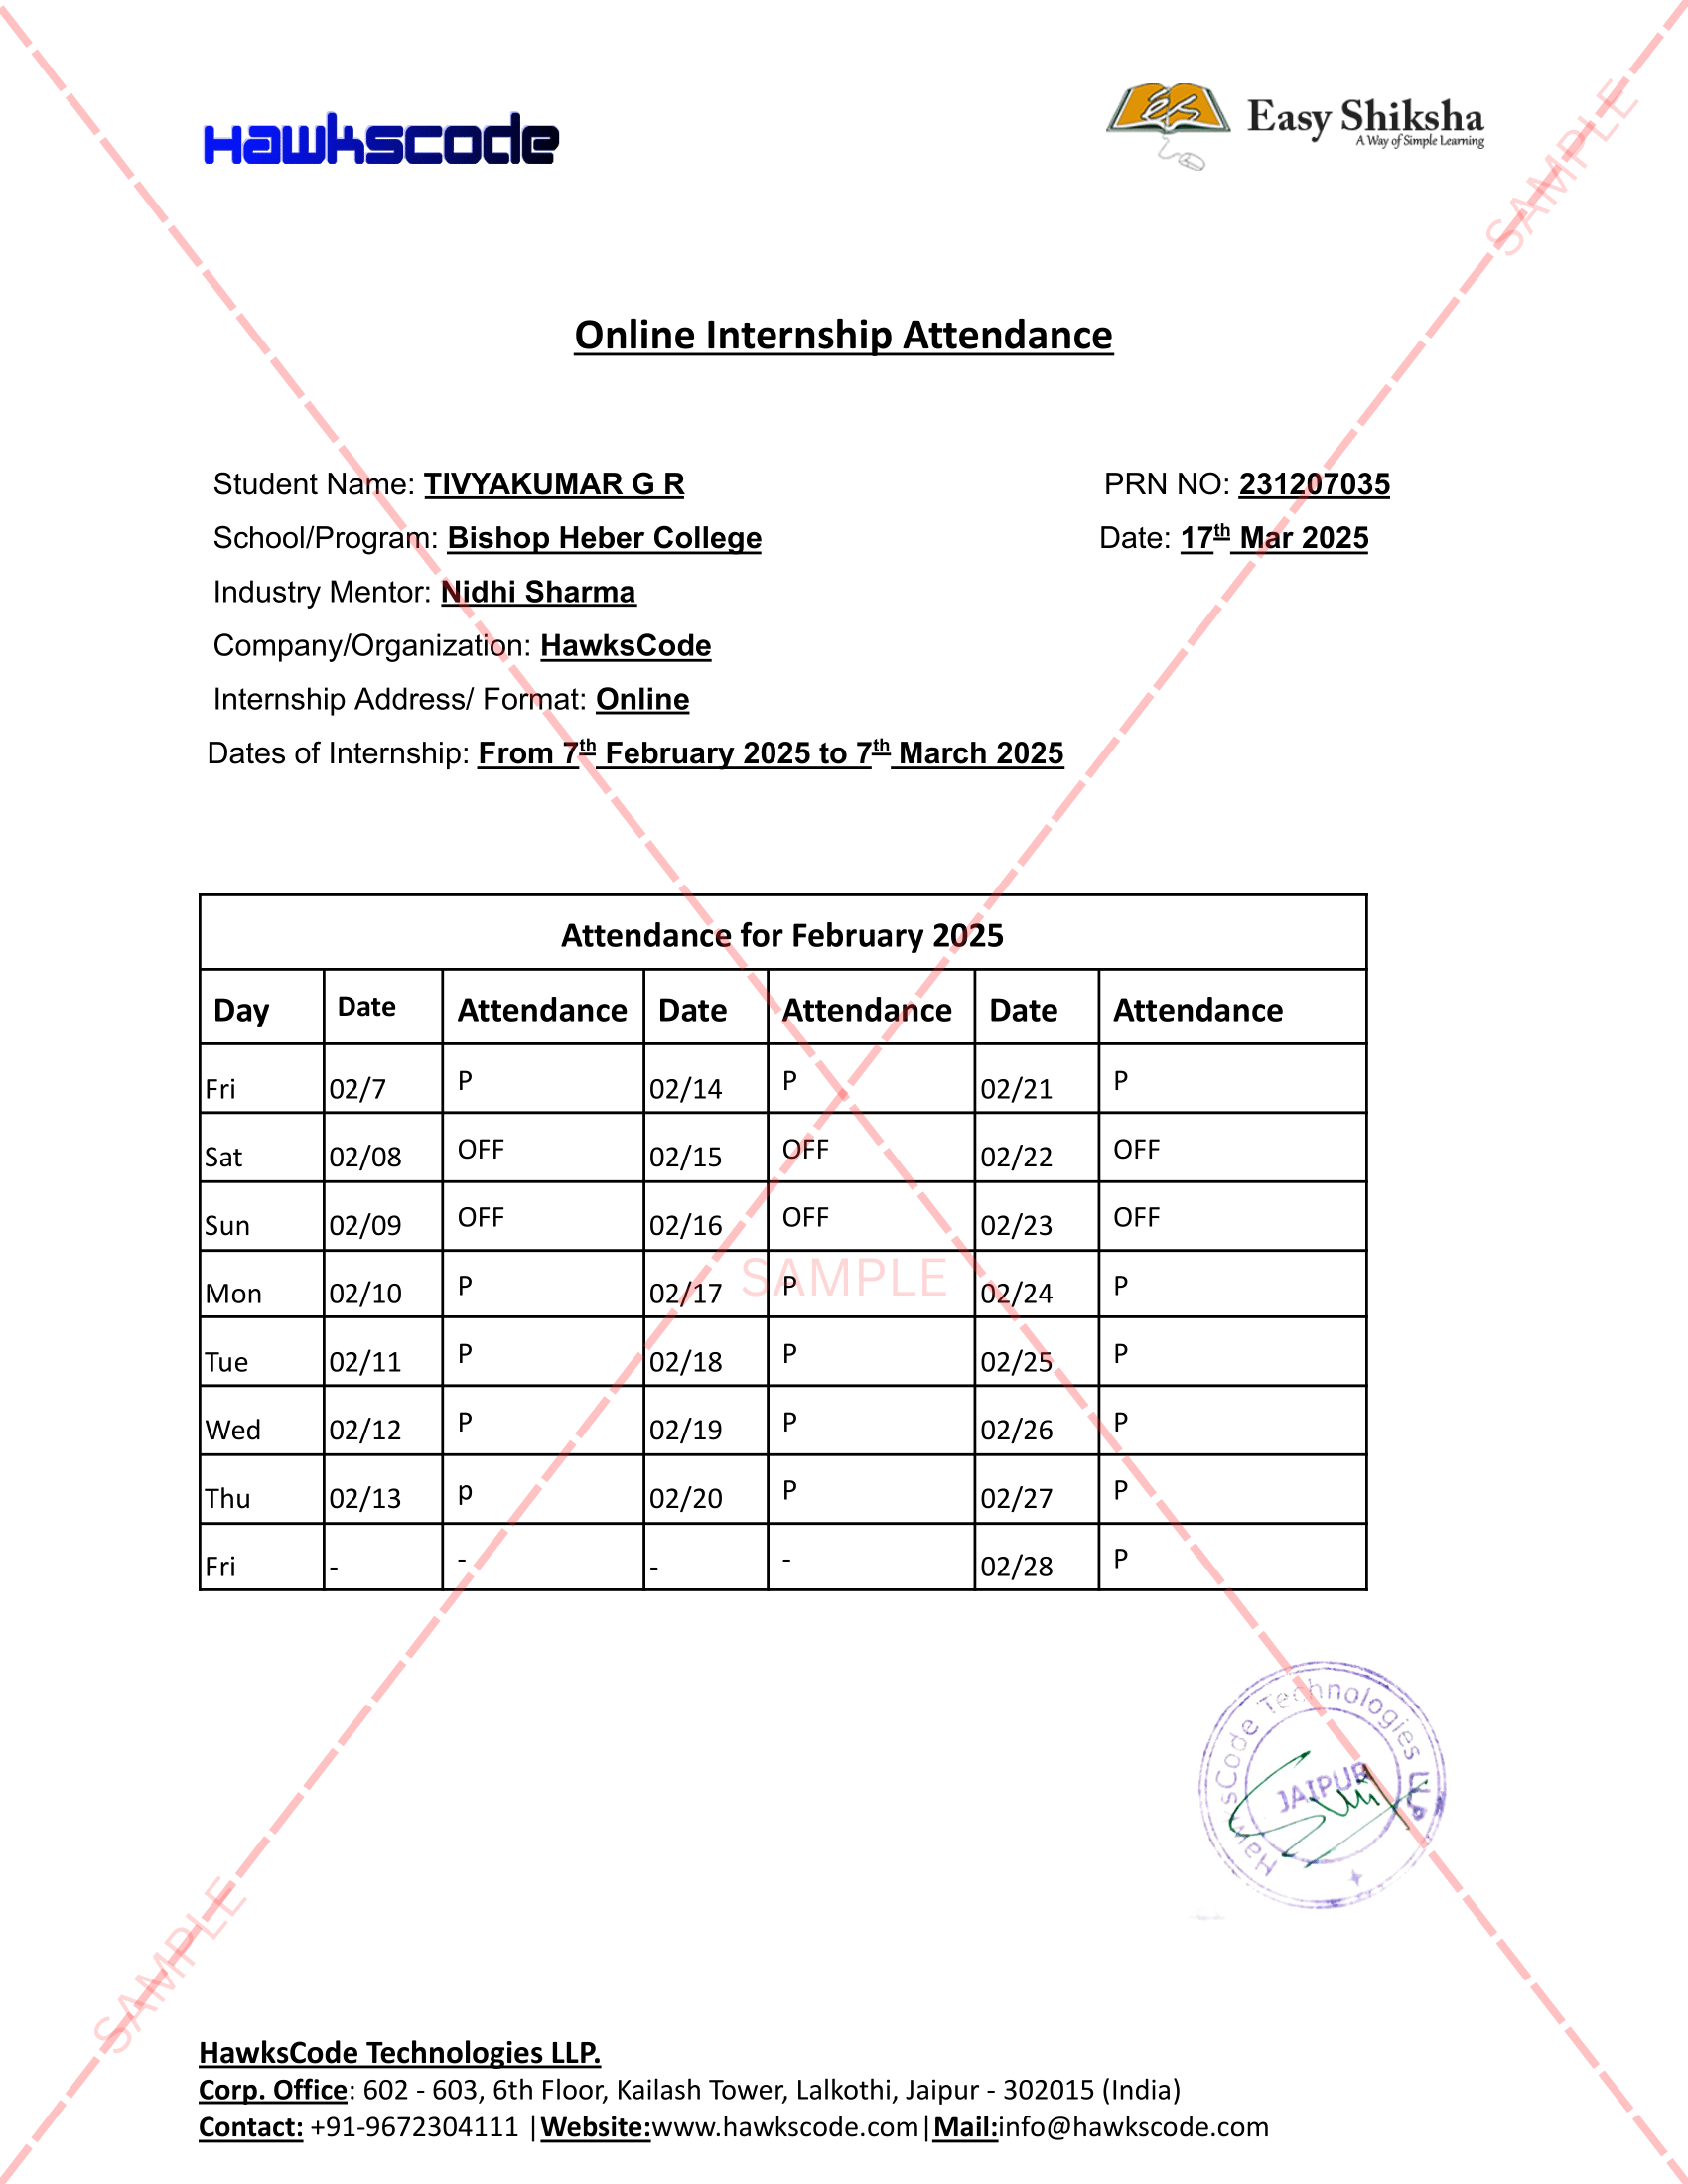
Internship Attendance Report
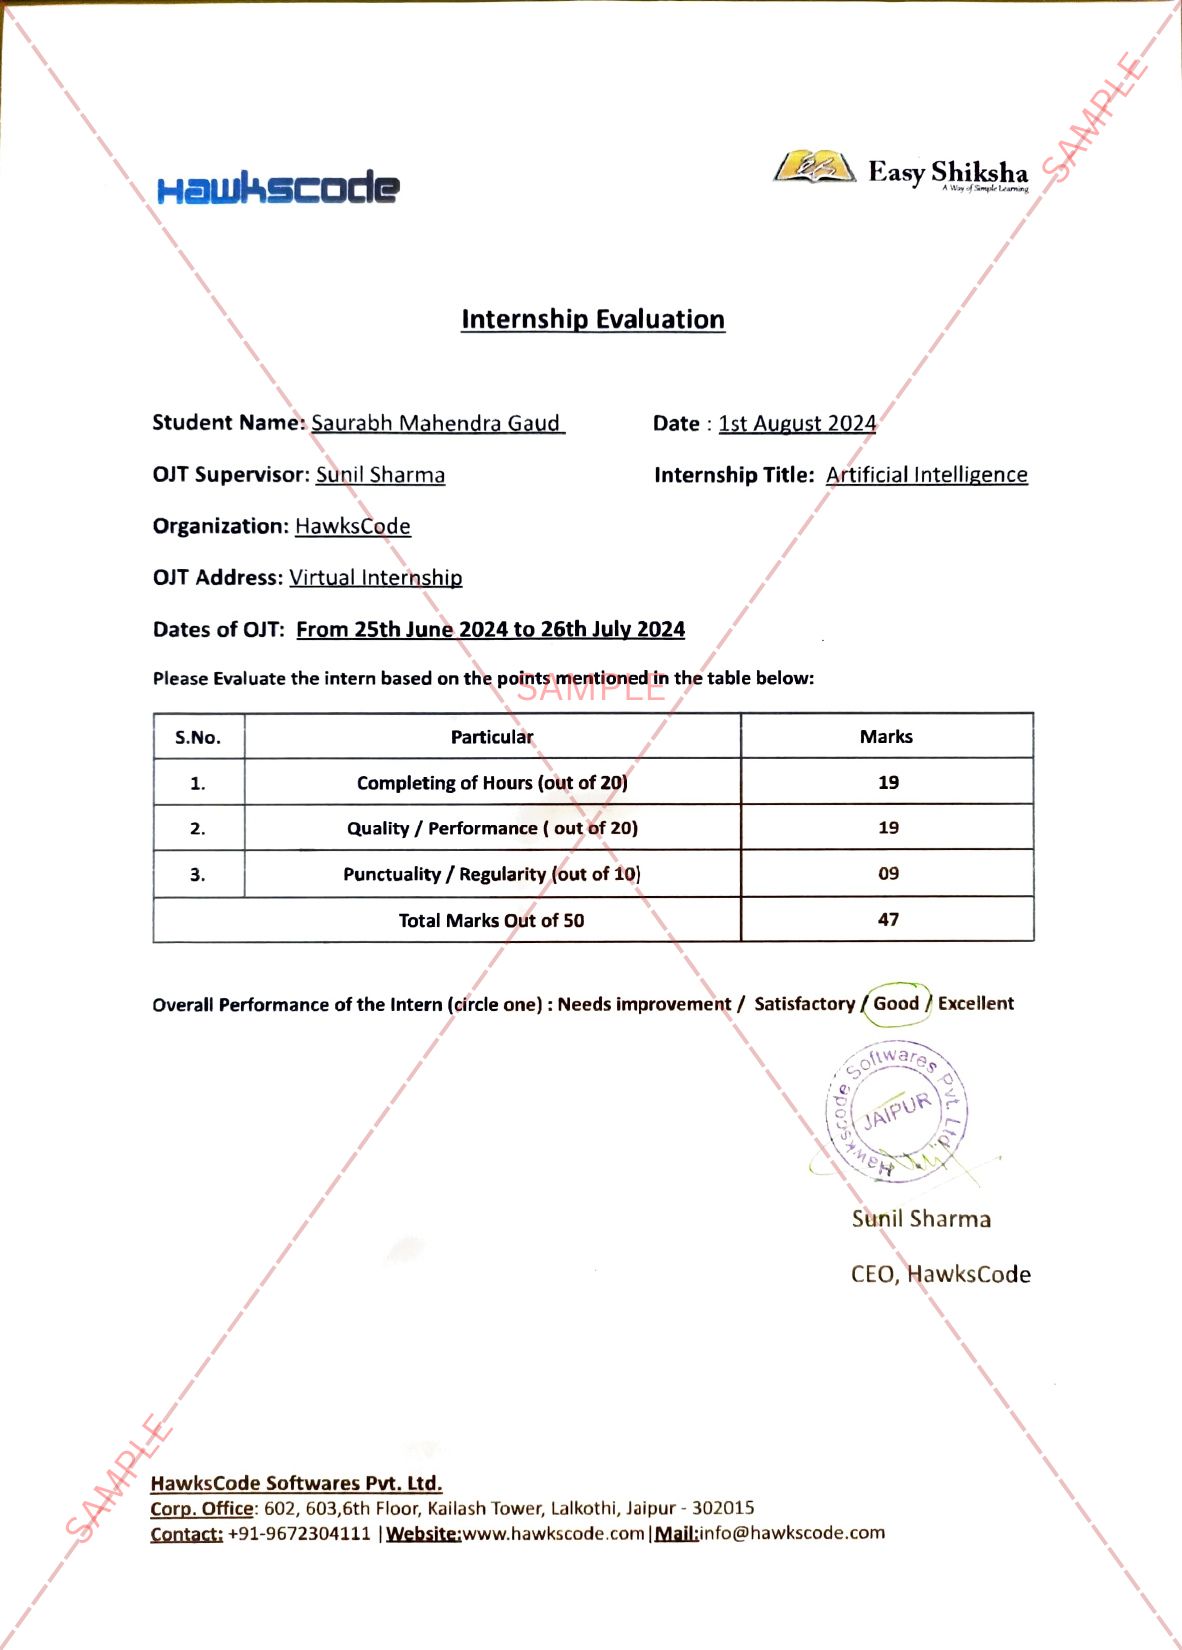
Internship Evaluation Report
Internship Certificate Hard Copy
Project Report Assitance
Internship Project Assitance
1:1 Live Mentor Call
Course Certificate in Elegant Wooden Frame
2 Certificates (Course + Internship) Lifetime Access Projects & Assignments
Chat with us first → 5 On-demand Videos Course Completion Certificate
Internship Certificate
Internship Joining/Offer Letter
Letter of Appreciation (LOA)
Internship Attendance Report
Internship Evaluation Report
Internship Certificate Hard Copy
Project Report Assitance
Internship Project Assitance
1:1 Live Mentor Call
Course Certificate in Elegant Wooden Frame
2 Certificates (Course + Internship) Lifetime Access Projects & AssignmentsWhy Start Now?
The Opportunity Won’t Wait.
Every day you delay is a missed opportunity to grow your skills. Learners who start today gain the advantage — whether it's building skills, improving careers, or unlocking new opportunities.
Still Thinking?
Here's everything that makes this a no-brainer:
No prior experience needed — start from absolute zero Beginner friendly — explained step by step Risk-free — 30-day full refund guarantee One-time payment — access forever Student-friendly pricing — see details at checkout Real internship certificate includedWhat Happens After You Enroll?
From payment to certificate — here's exactly what to expect
Imagine After Completing This Course
Picture yourself 30 days from now — with skills, experience, and credentials that open real doors.
 Includes Internship